900 Minute Rule: Make Per 90 Stats Work with Live Leaderboards
Per 90 stats normalize any countable statistic to a 90 minute match using the formula (stat ÷ minutes played) × 90, letting you compare a player who logs 1,200 minutes against one who logs 2,800 minutes on equal footing. The catch is reliability: treat any per‑90 figure as provisional until the player has crossed roughly 900 minutes played, and don’t lean hard on it until minutes clear 1,800.
TL;DR:
- Per 90 stats are only reliable after a player has accumulated at least 900 minutes, with greater stability occurring after 1,800 minutes.
- Comparing per 90 figures across leagues requires adjusting for competition quality using percentile rankings rather than raw numbers.
- Small sample sizes under 900 minutes often reflect noise, so outlier performances should be interpreted with caution and flagged accordingly.
- Metrics such as goals, xG, assists, and key passes serve different roles, and their meaningfulness depends on a player’s specific position and tactical role.
- Live platforms like BetsyScore update per 90 data in real time during matches, providing context for scouting, fantasy decisions, and performance analysis.
Table of Contents
- Understanding Per 90 Stats and How to Calculate Them
- Common Per 90 Metrics and What Each One Reveals
- How to Read Per 90 Stats by Position and League
- Setting Reliable Benchmarks and Handling Small Samples
- Using Per 90 Stats in Fantasy Soccer and Scouting Workflows
- Where Per 90 Stats Mislead You
- BetsyScore’s Applied Per 90 Examples
- Why Numbers Alone Never Tell the Full Story
- Put Per 90 Stats to Work on BetsyScore’s Live Leaderboards
- Where to Find Raw Per 90 Data
- Sources
- FAQ
Understanding Per 90 Stats and How to Calculate Them
The formula behind per 90 stats is simple arithmetic: divide the raw total by minutes played, then multiply by 90. A striker with 8 goals in 1,620 minutes finishes at 0.44 goals per 90, a figure that lets you stack him against a teammate who scored 6 in 900 minutes (0.60 per 90) despite playing half as much. That second player’s rate is higher even though his goal count is lower, which is exactly the distortion per 90 stats exist to fix, according to a free soccer stats calculator built for this exact math.
Working through a few examples makes the logic click faster than any explanation:
- Goals per 90: 11 goals in 2,340 minutes = (11 ÷ 2,340) × 90 = 0.42 G/90.
- Expected goals (xG) per 90: 9.8 xG in 2,160 minutes = (9.8 ÷ 2,160) × 90 = 0.41 xG/90.
- Key passes per 90: 47 key passes in 1,980 minutes = (47 ÷ 1,980) × 90 = 2.14 key passes/90.
- Tackles per 90: 63 tackles in 2,700 minutes = (63 ÷ 2,700) × 90 = 2.10 tackles/90.
Rounding matters more than it seems. Most public tables round to two decimal places, which is fine for browsing but can flatten real differences between two players separated by 0.03 goals per 90 over a full season. Event definitions matter just as much. Some providers strip penalties out of goals and xG entirely, others fold them in, and a blocked shot counts toward “shots” on one platform and gets excluded on another. Before you compare two per‑90 figures from different sites, confirm they’re built the same way, a detail covered well in this breakdown of how football stats are calculated.
Common Per 90 Metrics and What Each One Reveals
Soccer player statistics only become useful once you know which per‑90 number maps to which skill. Analysts group them roughly by phase of play, and each one tells a different part of the story.
- Goals per 90 (G/90) measures raw finishing output, but it swings with penalty count and shot volume, so pair it with xG.
- Expected goals per 90 (xG/90) estimates the quality of chances a player gets, stripping out finishing luck and giving a steadier read on a striker’s underlying threat.
- Assists per 90 and expected assists (xA) per 90 track chance creation, with xA smoothing out whether teammates actually converted.
- Shots per 90 shows attacking involvement and shot volume, useful for separating a poacher from a player who simply doesn’t shoot much.
- Key passes per 90 counts the final pass before a shot, a cleaner creative signal than raw assists for wingers and attacking midfielders.
- Progressive passes per 90 captures ball progression up the pitch, a metric that’s become central to how analysts evaluate midfield distributors.
- Tackles per 90 and interceptions per 90 flag defensive activity, though high numbers can mean either elite anticipation or a defense forced into constant recovery mode.
- Pressures per 90 shows work rate off the ball, especially relevant for wingers and pressing forwards.
- Saves per 90 and post‑shot expected goals (PSxG) minus goals allowed per 90 are the goalkeeper equivalents, isolating shot‑stopping quality from the defense in front of them.
Each metric is most meaningful when read alongside role. Tackles per 90 tells you almost nothing useful about a center forward, and shots per 90 tells you little about a defensive midfielder whose job is screening passing lanes rather than shooting. Per 90 stats function as the industry standard precisely because they let scouts strip playing time out of the equation and focus on rate of production, but the metric you check has to match the job the player is actually asked to do.
How to Read Per 90 Stats by Position and League
The same 0.35 goals per 90 means something completely different depending on who’s producing it. For a starting center forward in a top five league, 0.35 G/90 is below average and would raise questions about service or finishing. For a box‑to‑box central midfielder, that same 0.35 G/90 is a strong secondary scoring output layered on top of his primary job.
Rough benchmark ranges by role give you a starting frame:
- Elite forward: 0.5 to 0.8 non‑penalty goals per 90, often paired with 0.5+ xG per 90.
- Above‑average winger: 0.3 to 0.5 combined goals and assists per 90, with key passes per 90 in the 1.5 to 2.5 range.
- Strong holding midfielder: 2.0+ tackles plus interceptions per 90, with a pass completion rate that holds up under pressure.
- Reliable center back: 1.5 to 2.5 clearances and interceptions per 90 combined, with minimal high‑value errors.
- Solid starting goalkeeper: goals prevented per 90 (goals allowed minus PSxG) hovering near zero or better across a full season.
League context shifts every one of those ranges. A winger posting 0.5 combined goals and assists per 90 in a lower‑intensity league isn’t automatically comparable to a winger hitting the same number against Champions League defenses. This is where percentile framing helps: converting a raw per‑90 figure into a rank against a peer group of similar positions and similar competition level shows whether 0.5 is actually elite or merely decent, a technique laid out in DataMB’s guide to percentile conversion.
A typical threshold for a per‑90 number to become meaningful is around 900 minutes played, and even then, comparisons across leagues of different quality need the percentile adjustment to avoid misleading conclusions. A player putting up gaudy per‑90 numbers in 950 minutes deserves a second look before you rank him above a player with the same rate over 2,500 minutes.
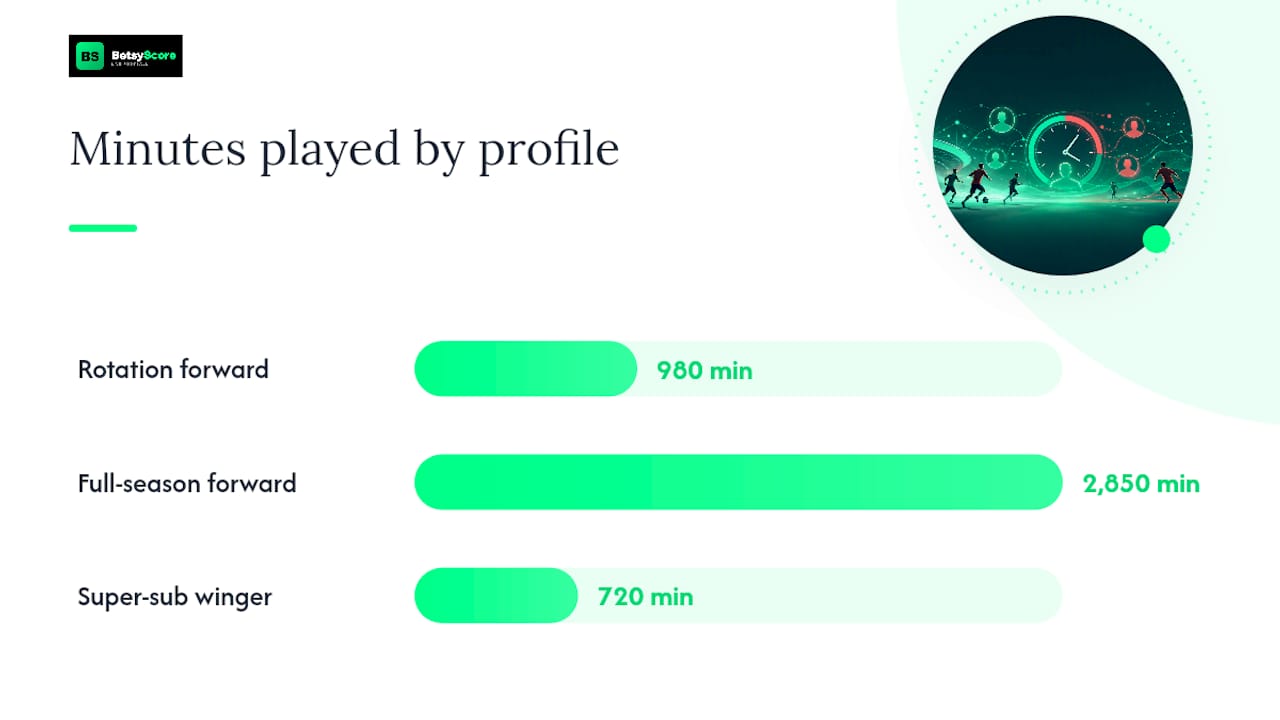
Side‑by‑side, the pattern is easy to see once you frame it by role and sample size instead of raw totals:
| Player Profile | G/90 | Minutes | Read |
|---|---|---|---|
| Rotation forward | 0.61 | 980 | Promising but unproven at scale |
| Full‑season forward | 0.47 | 2,850 | Reliable, lower ceiling on the surface |
| Super‑sub winger | 0.55 | 720 | Below the 900‑minute confidence floor |
Setting Reliable Benchmarks and Handling Small Samples
Small samples lie, and per‑90 stats are especially vulnerable because a single hot week can distort an entire season’s rate. Three thresholds and techniques keep that volatility in check.
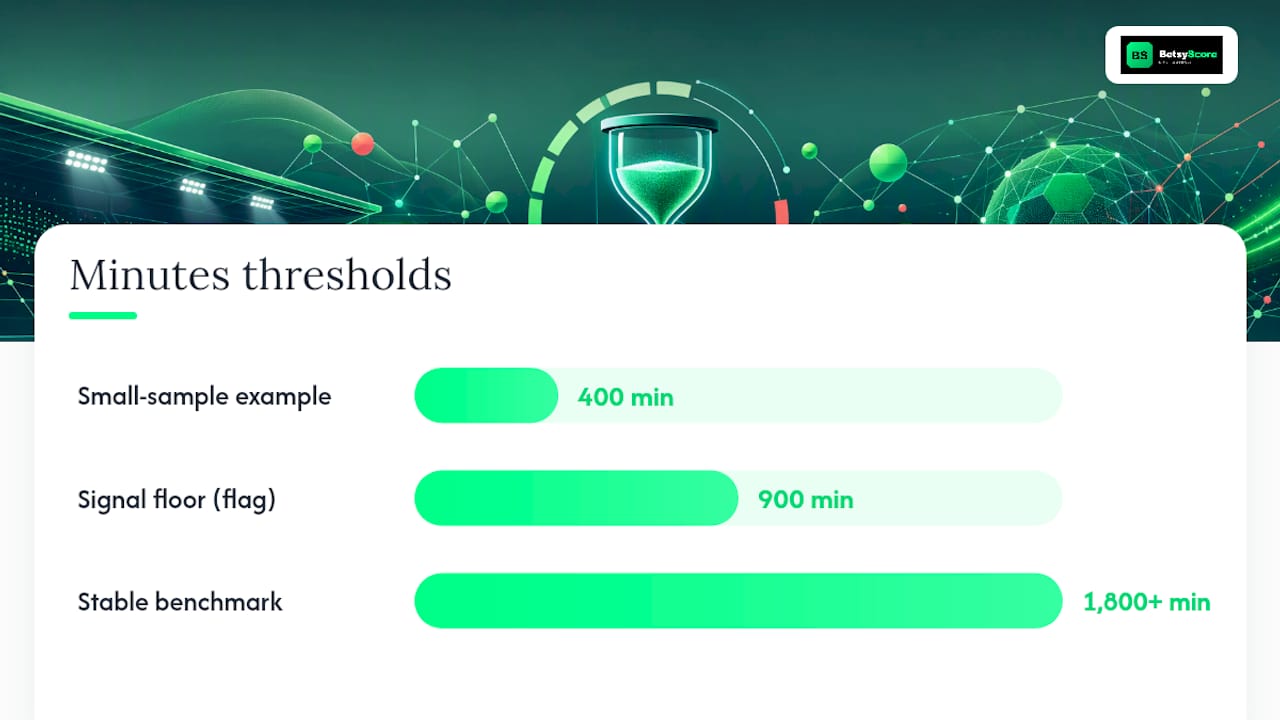
- Treat 900 minutes as the signal floor. Below that, a per‑90 figure is closer to noise than form, and the standard guidance is to withhold judgment until a player clears it.
- Wait for 1,800+ minutes for real stability. This is roughly twenty full matches, enough for hot streaks and cold runs to cancel each other out.
- Flag any comparison involving a player under the 900 minute mark. A visible caveat next to the number stops readers from over‑trusting a small‑sample outlier.
Regression to the mean explains why this matters. A player who scores four goals in his first 400 minutes of a season is running hot relative to his true skill level, and as minutes accumulate, his rate almost always drifts back toward a more typical number for his role and league. Analysts who chase early per‑90 spikes get burned by exactly this pattern every season.
Rolling windows help catch a real change in form without overreacting to one big match. Looking at a player’s per‑90 output over just his last 900 minutes, rather than his full season total, shows whether a hot streak is genuinely fresh production or a single outlier match propping up an old average. Confidence flags, whether a color code or a simple minutes tag next to the stat, let you spot at a glance which numbers in a table are load‑bearing and which are still fragile.
Pro Tip: When you’re scanning a leaderboard, sort by minutes played before you sort by the per‑90 metric itself. It takes five seconds and instantly filters out the small‑sample outliers that would otherwise dominate the top of the list.
Using Per 90 Stats in Fantasy Soccer and Scouting Workflows
Per 90 average calculations only pay off if you turn them into a repeatable process rather than a one‑off lookup. Three workflows cover most practical use cases.
- Fantasy lineup decisions. Start from expected minutes for the upcoming match, not season‑long averages, then multiply the player’s per‑90 rate by that expected share. A player with a strong per‑90 xG figure who’s about to be rotated is a worse pick than a lower‑ceiling player guaranteed 90 minutes.
- Scouting shortlists. Pull per‑90 numbers for the relevant metrics for the player’s specific role, then verify with video. A high progressive‑passes‑per‑90 figure means little if the underlying passes are safe sideways balls rather than genuine line‑breaking work.
- Match preview trends. Check a player’s per‑90 numbers over his last five to ten matches rather than his season total to catch short‑term form swings, useful for spotting a striker heating up before a fixture.
Scouting platforms increasingly build this comparison in directly, letting you toggle between raw totals and per‑90 mode to strip out playing‑time bias across an entire database at once.
Pro Tip: Never draft or bid on a fantasy asset based on per‑90 numbers alone if the underlying minutes are under 900. Check the fixture list for rotation risk first, then let the per‑90 rate break the tie between two similar options.
Where Per 90 Stats Mislead You
Per 90 stats fail in a few predictable ways, and knowing them in advance saves you from bad calls.
- Penalty and set‑piece inflation. A player who takes penalties or corners can post a goals or assists per 90 figure that overstates his open‑play production; always check the non‑penalty split.
- Role mismatch. Comparing a false nine’s shots per 90 to a target man’s ignores that they’re being asked to do fundamentally different jobs.
- Tactical context blind spots. A defensive midfielder in a team that dominates possession racks up fewer tackles per 90 than one constantly defending, not because he’s worse but because he faces fewer defensive actions.
- Provider inconsistency. Two sites can list different per‑90 figures for the same player because one counts blocked shots and the other doesn’t; always check the methodology before trusting a cross‑site comparison.
The fix in every case is the same: pair the number with a quick sanity check, whether that’s the non‑penalty split, the player’s tactical role, or a glance at how the source site defines its stats.
BetsyScore’s Applied Per 90 Examples
BetsyScore treats sample size as the gatekeeper for every per‑90 figure it surfaces. The platform’s own guidance on trusting xG per 90 after 900 minutes walks through Premier League leaderboard examples where a player’s underlying xG rate only earns a confidence flag once he clears that threshold, exactly the discipline this guide has argued for throughout.
Goalkeeper metrics get the same rigor. BetsyScore’s post on building PSxG models and measuring goals prevented per 90 lays out the evaluation threshold in plain terms:
A model benchmark of 0.818 AUC gives analysts a concrete line for judging whether a PSxG framework is actually separating strong shot‑stopping performances from noise, rather than just producing a number that looks scientific.
That work comes from Aria, a BetsyScore contributor whose analysis feeds into how leaderboards update. Because BetsyScore refreshes live data continuously, per‑90 figures on player profiles shift in near real time as minutes accumulate match by match, rather than sitting static until a weekly data pull.
Why Numbers Alone Never Tell the Full Story
Per 90 stats earn their place in any serious analysis because they strip out the noise of playing time and let you compare production rates honestly. That said, the number on its own is a starting point, not a verdict. A 0.6 xG per 90 forward who never receives the ball in dangerous areas without a specific pattern of play is a different asset than one who generates that number from broken play alone, and no per‑90 column captures that distinction.
The analysts who get the most out of this data treat it as a filter, not a final answer. Use per‑90 stats to narrow a list of forty players to five, then spend your limited attention on video for those five. Blend the rate with role, minutes, and a few match clips, and you’ll make sharper calls than either pure gut feel or pure spreadsheet ever could alone.
— Aria
Put Per 90 Stats to Work on BetsyScore’s Live Leaderboards
Live platforms provide per‑90 numbers immediately after matches end, rather than waiting for batch updates. Every player profile pairs raw totals with per‑90 rates, so you can confirm minutes played and production rate in the same glance instead of running the math yourself.

The platform’s live scores and stats hub updates every few seconds during matches, and its coverage of xG per 90 benchmarks shows exactly how the 900‑minute confidence rule plays out across a real Premier League season. Pair that with the AI‑powered predictions built from expected goals, recent form, and head‑to‑head data, and you get a fuller picture than a per‑90 number alone can offer heading into a match. If you’re scouting a transfer target or setting your fantasy lineup this week, use an appropriate platform to check player minutes and per‑90 figures, and let that context guide the call.
Where to Find Raw Per 90 Data
For readers who want to pull the raw tables themselves, a handful of sources cover most needs:
- FIFA’s official player statistics pages for World Cup 2026 leaderboards.
- MLS’s official stats portal for live league leaderboards and downloadable data.
- BetsyScore’s World Cup hub for live tournament stats alongside per‑90 context.
- Free calculators for the per‑90 formula itself when you want to run the math on a custom stat.
Sources
- Free Soccer Stats Calculator — Per 90 & Efficiency Metrics (2026)
- Per 90 Stats in Football Explained: Why They Matter More Than Raw Numbers
- Player Stats | FIFA World Cup 2026™
- Advanced Player Search — Free Football Player Finder & Database | ScoutingStats
- Mlssoccer
FAQ
What Is a Good Per 90 Stat for a Forward?
An elite forward typically posts 0.5 to 0.8 non‑penalty goals per 90, often backed by a similarly strong xG per 90 figure, though league quality shifts that range.
How Many Minutes Do You Need Before Trusting Per 90 Stats?
Most analysts treat 900 minutes as the minimum floor for a meaningful signal, with 1,800 or more minutes needed for real stability.
Can You Compare Per 90 Stats Across Different Leagues?
You can, but only after adjusting for league quality, ideally through percentile ranking rather than comparing raw numbers directly, since per 90 outputs mean different things in different competitions.
Why Do Two Websites Show Different Per 90 Numbers for the Same Player?
Providers often define events differently, such as whether penalties or blocked shots count toward a stat, so always check each site’s methodology before comparing figures directly.
Where Can I See Live Per 90 Stats During a Match?
BetsyScore’s live match hub updates player and team data every few seconds, letting you track per‑90 trends and momentum shifts as a match unfolds.