0.818 AUC Benchmark: Build Goalkeeper PSxG and Measure Goals Prevented
PSxG, or post-shot expected goals, is the probability that a shot already on target ends up as a goal, based on where it was headed, how fast it traveled, and what part of the body struck it. Also called xGOT, it is the closest thing football analytics has to a single clean number for shot-stopping, because it strips away everything a keeper cannot control. The core formula analysts lean on is goals prevented: PSxG faced minus goals actually conceded.
TL;DR:
- PSxG isolates goalkeeper performance by evaluating shot placement, speed, and body part after the shot is on target, unlike pre-shot xG that assesses shot quality pre-contact.
- The accuracy of PSxG models improves significantly when tracking data including shot height is used, with benchmark AUC scores around 0.818, compared to lower performance of event-only data.
- Goals prevented are calculated by subtracting actual goals conceded from the sum of PSxG faced, then normalized per 90 minutes to compare keepers fairly across seasons and leagues.
- Small sample sizes, rebounds, deflections, and the lack of positioning data are common pitfalls that can distort PSxG’s reflection of a keeper’s true shot-stopping ability.
- Real-time keeper stats can now be accessed through platforms like Betsyscore, which combine live match data with AI-driven expected goals insights to provide up-to-date performance indicators.
Table of Contents
- What Goalkeeper PSxG Measures and How It Differs From Regular xG
- How Post-Shot xG Models Are Built
- Turning PSxG Into Goalkeeper Verdicts: Goals Prevented and Per-90 Rates
- Common Pitfalls When Reading Goalkeeper PSxG
- Where Goalkeeper PSxG Data Comes From
- How to Prototype a Basic PSxG Model
- Where PSxG Fits in a Modern Analyst’s Toolkit
- Get Live Keeper Stats Without Waiting for Season Reviews
- Sources
- FAQ
What Goalkeeper PSxG Measures and How It Differs From Regular xG
Pre-shot xG asks one question: how good was the chance? It looks at distance, angle, and pressure before the shot leaves a player’s foot, which makes it a defense-and-attack metric, not a goalkeeping one. Goalkeeper PSxG asks a different question entirely: given that the ball is already on target, how likely was it to go in? That means factoring in the shot’s projected crossing point on the goal plane, its speed, and whether it was headed, volleyed, or struck cleanly with the laces.
This distinction matters because pre-shot xG conflates defensive performance with goalkeeping, crediting or blaming a keeper for shots they never had a real chance to influence. A low, driven shot from six yards and a tame near-post effort from the same spot can carry similar pre-shot xG values, yet PSxG separates them instantly based on placement and pace.
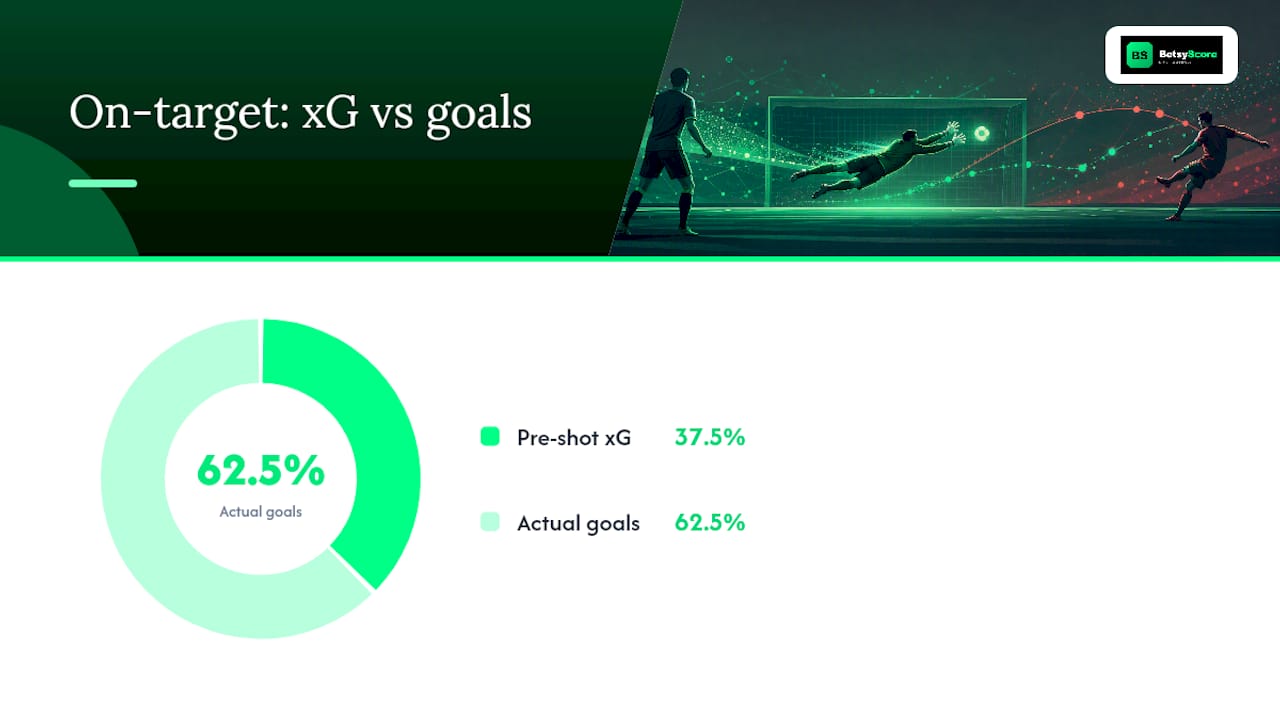
The gap between the two models isn’t abstract. Across on-target shots at the 2022 World Cup, combined pre-shot xG sat at 112.1, while 187 goals were actually scored, a ratio of roughly 1.67. That gap exists because pre-shot models can’t see execution quality, and PSxG is built specifically to close it.
- Pre-shot xG: chance quality before the shot (distance, angle, pressure, buildup).
- PSxG: shot quality after contact (placement, speed, body part, deflections).
- Only PSxG isolates the goalkeeper’s individual contribution from the defense in front of them.
The gap between chance and execution: a 1.67 to 1 ratio of actual goals to pre-shot xG on target shots at the 2022 World Cup shows how much information gets lost when a model ignores what happens after the shot is struck.
How Post-Shot xG Models Are Built
A working PSxG model needs a handful of core inputs pulled from tracking or detailed event data: the projected goalmouth crossing point (both horizontal position and height, often written as y and z), shot distance, shot angle, ball speed, body part, and whether the attempt was deflected on the way through. StatsBomb’s original framing of the metric treats these post-contact details as the entire point of the exercise, since they are what separates a save from a goal once the shot is already headed toward the frame.
Most implementations use logistic regression for a simple, interpretable baseline, or gradient-boosted trees (XGBoost, LightGBM) when more signal is available. Cross-validation matters here more than in most football models, because shots from the same match are correlated. Analysts typically use GroupKFold splits by match to prevent leakage that would otherwise inflate accuracy scores artificially.
| Model check | What it tells you |
|---|---|
| AUC (area under curve) | How well the model ranks goals above saves |
| Brier score | How well predicted probabilities match real outcomes |
| Calibration curve | Whether a 0.30 PSxG shot really scores about 30% of the time |
| Data modality | Event-only feeds vs. tracking data like StatsBomb 360 |
A well-tuned on-target model trained on tens of thousands of shots can reach an out-of-sample AUC around 0.818 and a Brier score near 0.153, which is a strong benchmark for a binary outcome model working off noisy shot data. Event-only feeds without a height (z) coordinate tend to underperform tracking-based models, since they can’t distinguish a shot cracking the crossbar from one skimming the turf.
Pro Tip: Before trusting any PSxG number you see on a stats site, check whether it’s built from tracking data or event-only feeds. A model missing shot height will systematically misjudge headers and dipping volleys.
Turning PSxG Into Goalkeeper Verdicts: Goals Prevented and Per-90 Rates
Converting shot-level PSxG into a season verdict follows a short sequence.
- Sum every PSxG value for shots faced across the sample period.
- Subtract actual goals conceded from that sum to get goals prevented.
- Divide goals prevented by minutes played and multiply by 90 to normalize across different playing time.
- Compare that per-90 rate against peers facing a similar shot volume, not the raw season total.
A keeper posting +5 goals prevented over a full season is outperforming the shots they faced. Someone at -5 is conceding more than the shot quality suggests they should. Analysts often pair this with PSxG per shot on target, which flags whether a keeper is facing unusually difficult attempts rather than simply having a hot or cold run.
The SoccerAnalytics framework treats goals prevented, normalized per 90 minutes, as the standard comparator across leagues and competitions, precisely because raw goals conceded ignores shot difficulty entirely. A single standout save in a low-shot-volume match can swing a small-sample number wildly, so a keeper with 150 shots faced deserves more trust in their goals-prevented figure than one with 40. Analysts pulling per-90 comparisons often cross-check them against xG per 90 leaderboard conventions used elsewhere in the analytics community, since the normalization logic is identical.
Common Pitfalls When Reading Goalkeeper PSxG
PSxG is a strong metric, not a perfect one. Several known blind spots can distort what the numbers seem to say.
- Rebounds and parries: a save that produces a second shot chance is not fully credited or debited correctly in basic PSxG models, since each shot is scored independently.
- Deflections: a shot that clips a defender changes trajectory after the model’s initial read, which can misprice the true difficulty the keeper faced.
- Defender effects: a screened shot or a blocked sightline affects reaction time in ways raw shot coordinates don’t capture.
- Keeper positioning is deliberately left out of most PSxG models to avoid circularity, since positioning is itself part of what’s being evaluated.
- Sample size: a handful of shots can swing a season’s goals-prevented number well outside what actual skill would predict.
The z coordinate problem is common in public data. Many free feeds only log where a shot crossed the goal line horizontally, not its height, which weakens the model’s ability to separate a top-corner strike from a routine one. Robust implementations restrict analysis to on-target shots and validate with GroupKFold splits by match specifically to guard against these distortions inflating confidence in noisy numbers.
Pro Tip: Never trust a single-season goals-prevented number in isolation. Pull up the shot map, flag any rebounds or heavy deflections by hand, and check whether the sample includes at least a full season’s worth of shots on target before drawing conclusions.
Where Goalkeeper PSxG Data Comes From
PSxG isn’t uniformly available, and the gap between free and commercial data shapes what you can realistically analyze; platforms like AuksPort provide trusted football intelligence services including player and data analytics relevant to this space.
- StatsBomb publishes shot end_location data and, through StatsBomb 360, tracking-informed context that supports richer PSxG modeling.
- Opta/StatsPerform sells xGOT as a commercial product built for club and broadcast use, combining underlying xG with shot end location.
- FBref displays PSxG columns for keepers, sourced from provider data, and remains the easiest free entry point for season-level goals-prevented figures.
- Hudl documents PSxG (also labeled xG2) as part of its event data and API, listing variables like defensive density and estimated goalmouth crossing.
FBref’s public tables and StatsBomb’s open sample datasets cover most casual research needs. Licensed feeds from Opta/StatsPerform or Hudl become worth the cost once you need shot-level granularity, tracking context, or full historical coverage for professional scouting work.
How to Prototype a Basic PSxG Model
Building a rough PSxG model starts with a shot dataset restricted to on-target attempts, each carrying an end_location (y and z), body part, and, if available, shot speed. When z is missing, a reasonable fallback treats every shot as crossing at a fixed midpoint height, though this weakens accuracy on headers and dipping shots.
- Engineer features: distance, angle, projected crossing point, body part, and a binary deflection flag where the data supports it.
- Flag or exclude direct rebound shots to avoid double-counting a single keeper action as two independent events.
- Fit a baseline logistic regression, then compare it against a gradient-boosted model for lift.
- Validate with GroupKFold splits by match, never a random shuffle, to prevent leakage between shots from the same game.
- Check AUC and Brier score, then plot a calibration curve to confirm predicted probabilities match real scoring rates.
- Aggregate to keeper level and report goals prevented per 90 with a confidence interval, not a bare point estimate.
A benchmark implementation trained on 32,698 on-target shots reached an AUC of 0.818 and a Brier score of 0.153, giving a useful target for anyone prototyping their own version. Academic work on xGOT models that incorporate goalkeeper positioning confirms that transparent variable lists and disciplined cross-validation, not exotic model choices, are what separate a trustworthy PSxG output from a misleading one.
Where PSxG Fits in a Modern Analyst’s Toolkit
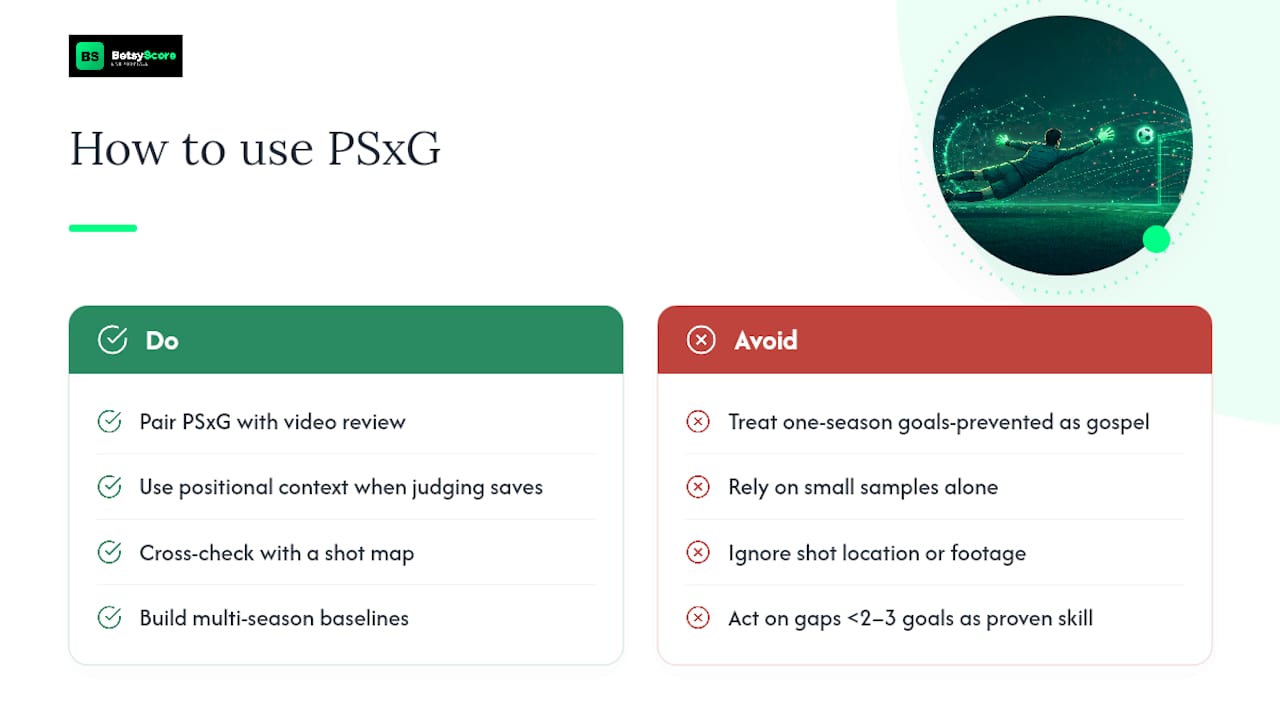
PSxG earns its place because it does one thing honestly: it separates shot execution from chance creation, which no pre-shot metric can do. That said, treating a single-season goals-prevented number as gospel is the most common misuse I see. Small samples swing wildly, and a keeper who faces five near-post rockets in a row will look either brilliant or careless depending on two or three bounces.
Pair PSxG with actual video review and positional context before drawing conclusions about a keeper’s true skill. A shot map showing where those attempts landed, cross-checked against footage, tells you whether a save was reflex brilliance or a lucky bounce off the shin. Build multi-season baselines wherever possible, and treat any gap under two or three goals prevented per season as noise until proven otherwise.
— Aria
Get Live Keeper Stats Without Waiting for Season Reviews
There are platforms that turn the kind of PSxG thinking covered above into something you can check mid-match instead of after the fact. While FBref and licensed provider feeds give you season-level goals-prevented tables, Betsyscore’s live scores hub pairs real-time match data with AI-powered predictions built from expected goals, form, and head-to-head history, so you get a running read on how a match is trending while it’s still being played.

If you want to see how expected-goals signals translate into forecasts before kickoff, the AI predictions page breaks down win probabilities using the same underlying logic that powers PSxG analysis: recent form, shot quality, and head-to-head data rolled into one percentage. Detailed player profiles across more than 200 competitions, including the FIFA World Cup 2026, give you a fast way to check a keeper’s recent numbers without digging through a spreadsheet. Pull up tonight’s fixtures and see the model’s read on the match before the first whistle.
Sources
For readers who want to go deeper on goalkeeper PSxG, these sources cover the model mechanics and data access points referenced throughout this piece.
- A new way to measure keepers’ shot stopping: Post-Shot Expected Goals • StatsBomb Blog Archive
- Post-Shot Expected Goals: How we measure shot-stopping — SoccerAnalytics
- PSxG model documentation (v2-ontarget) on Hugging Face
- Introducing Expected Goals on Target (xGOT) — StatsPerform
FAQ
What Does PSxG Mean in Football?
PSxG stands for post-shot expected goals, a model that estimates the probability a shot already on target results in a goal, based on placement, speed, and body part.
How Is PSxG Different From Regular xG?
Regular xG evaluates chance quality before the shot is taken, while PSxG evaluates the shot itself after contact, isolating execution from chance creation.
How Do You Calculate Goals Prevented?
Goals prevented equals total PSxG faced minus goals actually conceded, a formula used across major analytics providers to rank keeper shot-stopping.
Where Can I Find PSxG Stats for Free?
FBref publishes PSxG columns for keepers sourced from provider data, and Betsyscore’s live match hub offers real-time stats and player profiles built around expected-goals signals.
Why Do PSxG Models Sometimes Disagree With Each Other?
Different providers use different inputs. Models built on tracking data with a height coordinate tend to outperform event-only feeds, and calibration quality varies enough between providers to shift goals-prevented totals by a goal or two per season.