How Football Stats Are Calculated: A Complete Guide
Football statistics are calculated by combining real-time human event coding with automated optical tracking technology, producing thousands of data points per match that analysts and fans use to evaluate performance. Understanding how football stats are calculated separates informed analysis from surface-level reading of a scoreline. Providers like Opta and StatsBomb have built industry-standard methodologies that define what counts as a pass, a tackle, or a shot. Elite matches generate over 2,000 distinct data points per game. That volume reflects how deeply modern football performance evaluation has evolved beyond goals and assists.
How are football stats collected during a match?
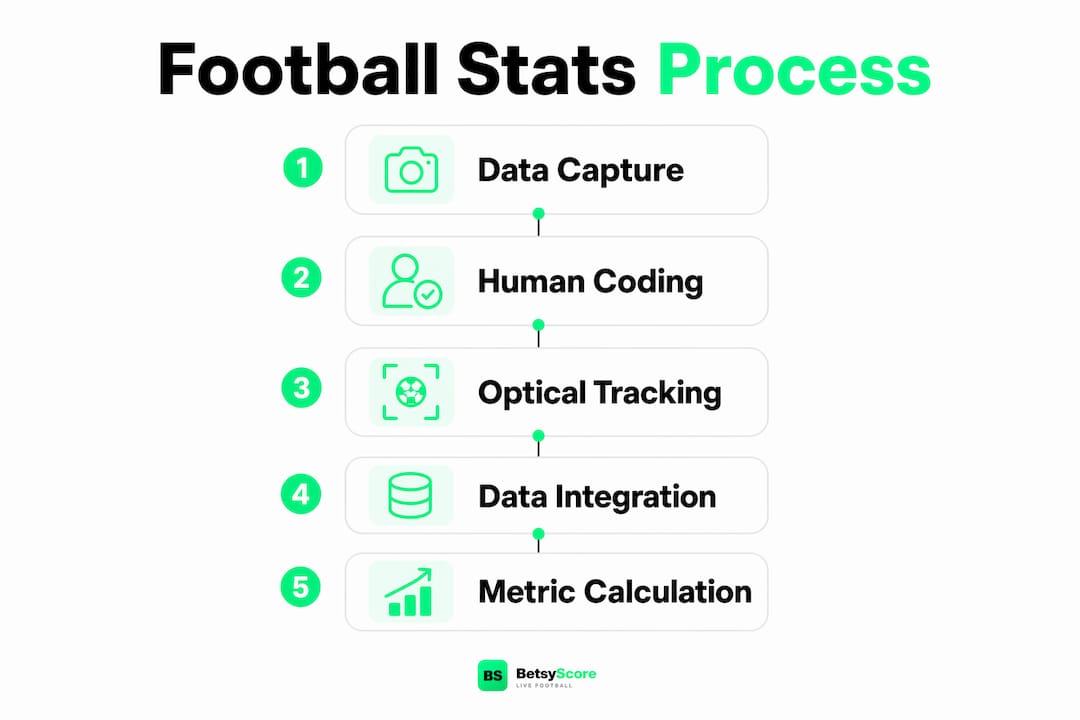
Football data collection starts the moment the referee blows the opening whistle. Two parallel systems run simultaneously: human analysts coding on-ball events and automated cameras tracking every player’s position.
Human coders log every observable action on the ball. That includes passes, shots, tackles, interceptions, dribbles, fouls, and clearances. Each event is tagged with a timestamp, location on the pitch, and outcome. The definitions for these events follow strict standards. Opta’s event definitions standardize what constitutes a pass, a shot, or a tackle, enabling valid comparisons across leagues and competitions.
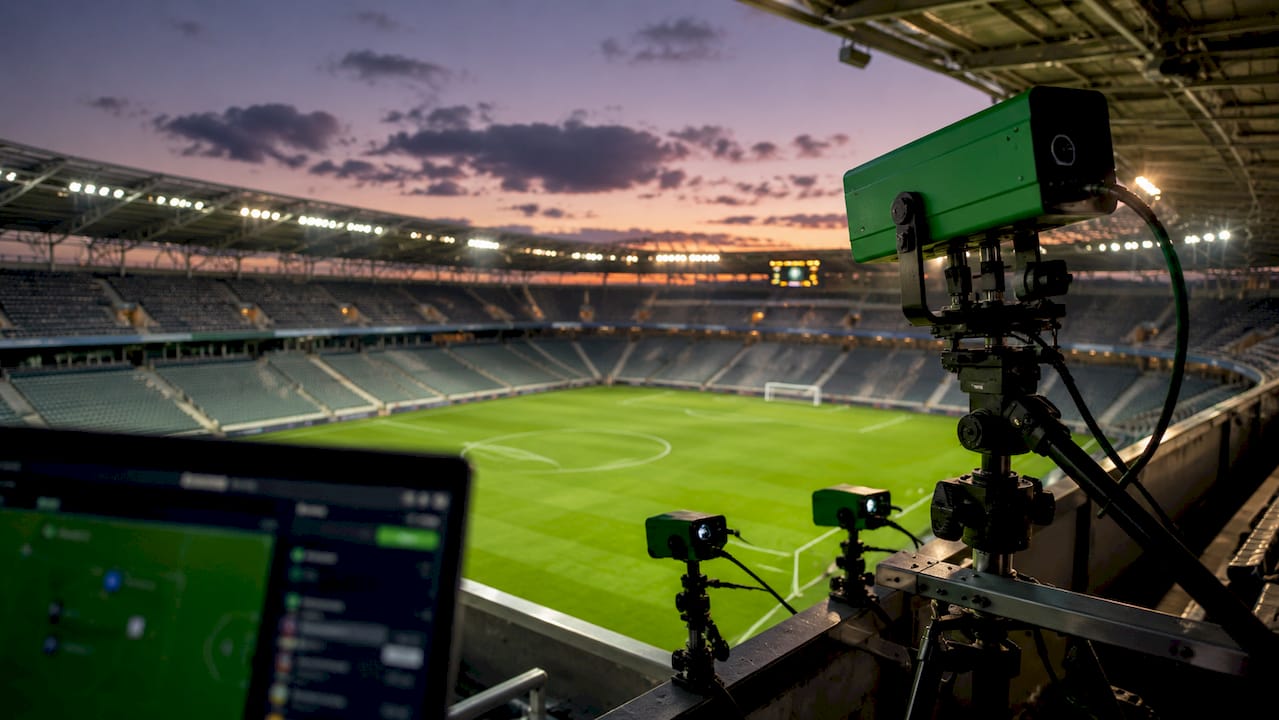
Alongside human coding, automated camera systems track players at 25 frames per second, capturing positional data for every player and the ball throughout the match. This off-ball tracking produces movement data that human coders cannot feasibly log manually. Camera-based systems use computer vision to identify player coordinates, speed, and distance covered. Sensor-based systems, used in some leagues, embed chips in the ball or player vests for even more granular positional data.
The data flow from stadium to end user follows a defined path:
- Event capture: Human coders and tracking cameras log data in real time at the stadium.
- API transmission: Data packets transmit through APIs to broadcast partners, apps, and club analytics platforms.
- Live delivery: Broadcast graphics receive data within 1–2 seconds of the event.
- Post-match review: Analysts refine and verify the full dataset, with finalized stats available 24–48 hours after the final whistle.
Live stats reach broadcasters within seconds, while fully reviewed figures arrive later. That gap explains why a stat shown on a broadcast may differ slightly from the official post-match record.
How key football performance metrics are calculated
Calculating football performance metrics requires precise formulas, not just counting events. The methodology behind each metric determines what it actually measures.
Possession percentage
Possession is one of the most misunderstood stats in football. Three distinct methods exist for calculating it: passing time, ball-touch time, and event-count ratio. Each produces a different result.
| Method | How it works | Typical effect |
|---|---|---|
| Passing time | Measures time the ball is in active passing sequences | Over-credits possession-heavy teams |
| Ball-touch time | Measures duration of direct ball contact | Produces lower possession percentages overall |
| Event-count ratio | Divides a team’s on-ball events by total match events | Simpler but less time-accurate |
Broadcast possession figures often vary by 4–6 percentage points between providers. That variation is not an error. It reflects genuinely different methodologies. When you see two broadcasters showing different possession numbers for the same match, both can be technically correct.
Expected goals (xG)
Expected goals is the most widely discussed advanced metric in modern football. xG assigns a probability to each shot based on historical data from thousands of similar attempts. The model factors in shot distance, angle, assist type, body part used, and defensive pressure at the moment of the shot.
A penalty carries an xG of approximately 0.76–0.79. A long-range effort from outside the box may register as low as 0.03. Summing all shot probabilities across a match gives each team a total xG figure that reflects how many goals the quality of their chances deserved.
Expected assists (xA) and progressive passes
Expected assists measure the probability that a completed pass will result in a goal. Rather than crediting a player only when their pass leads to an actual goal, xA sums the xG value of every shot their passes created. A player who consistently plays passes into high-probability shooting positions accumulates high xA regardless of whether their teammates convert.
Progressive passes measure how often a player advances the ball toward the opponent’s goal. The standard definition requires the pass to move the ball at least 10 meters closer to the goal line, or into the final third. Pressing intensity metrics count how often a team attempts to win the ball back within a set number of seconds of losing possession.
Pro Tip: When comparing xG or xA figures across leagues, check which provider generated the data. Opta and StatsBomb use different shot models, so their xG values for the same match will not always match.
What role do humans and technology play in verifying football data?
Pure AI-based event coding is not yet reliable enough for elite professional football without human oversight. The hybrid model is the current industry standard, combining automated tracking with specialist human analysts.
The Opta Forza approach illustrates how this works in practice. Three human analysts code a single match simultaneously, each specializing in a different category:
- Possession and passing analyst: Logs every pass, its outcome, and its location. This analyst tracks sequences and builds the possession chain.
- Defensive events analyst: Codes tackles, interceptions, clearances, blocks, and aerial duels. Defensive actions require judgment calls that automated systems still struggle to classify correctly.
- Shots and complex events analyst: Records every shot attempt, its location, the assist type, and any set-piece context. This analyst also handles events like fouls and cards.
- Quality assurance reviewer: A fourth analyst monitors the output of all three coders in real time, flagging inconsistencies and correcting errors before data transmits.
Human analysts ensure data consistency by adhering to strict event definitions regardless of the league or competition. Automated systems handle off-ball positional data, where volume makes human coding impractical. The combination produces a dataset that neither system could generate alone.
Pro Tip: When a stat looks surprising, check whether it came from a live feed or a post-match reviewed dataset. Live figures carry more potential for coding errors than finalized stats published the following day.
Disagreements between Opta and StatsBomb often reflect different methodologies rather than mistakes. Analysts who understand this avoid drawing false conclusions from cross-provider comparisons.
How are football statistics used by fans, analysts, and professionals?
Football data serves a wide range of audiences, each using the same underlying metrics for different purposes.
Broadcast and media: Live match graphics pull from real-time data feeds to display possession, shots on target, pass accuracy, and distance covered. These figures update within seconds of each event. Understanding that broadcast stats come from live feeds, not reviewed data, helps fans interpret them with appropriate context.
Club coaching and scouting: Coaches use post-match reviewed datasets to evaluate tactical patterns, identify pressing triggers, and assess individual player contributions. Scouting departments use metrics like progressive passes, xA, and defensive actions per 90 minutes to compare players across leagues. The standardized event definitions from Opta make those cross-league comparisons valid. Without consistent definitions, a “tackle” in the Premier League might not mean the same thing as a “tackle” in the Bundesliga.
Betting markets: Bookmakers adjust live odds based on match events as they happen. A red card, a goal, or a sustained period of high xG shifts the probability models that drive in-play pricing. The speed of data delivery directly affects how quickly odds move.
Fan platforms and apps: Fans access football statistics through apps and websites that display live scores, player ratings, and match predictions. Platforms like Betsyscore use these metrics to power AI-driven match predictions, translating raw data into win probabilities that update minute by minute. Knowing how the underlying stats are generated helps fans evaluate those predictions critically rather than accepting them at face value.
The practical value of understanding how live scores work extends to interpreting every stat attached to them. A possession figure, an xG total, or a pass completion rate all carry more meaning when you know how they were built.
Key Takeaways
Football statistics are calculated through a hybrid system of human event coding and automated optical tracking, with standardized definitions ensuring that metrics like xG and possession remain comparable across competitions.
| Point | Details |
|---|---|
| Data volume per match | Elite matches produce over 2,000 data points through combined human and automated collection. |
| Possession varies by method | Broadcast possession figures can differ by 4–6 points depending on whether providers use passing time, touch time, or event counts. |
| xG uses shot probability | Expected goals assigns each shot a probability based on distance, angle, assist type, and defensive pressure. |
| Humans remain essential | Pure AI coding is not reliable enough at elite level; a hybrid model with specialist human analysts is the industry standard. |
| Provider methodology matters | Differences between Opta and StatsBomb figures reflect different models, not errors, so cross-provider comparisons require care. |
Why the methodology behind football stats matters more than the numbers themselves
The football analytics field has produced extraordinary tools over the past decade. xG, xA, progressive passes, and pressing metrics have genuinely changed how clubs evaluate players and build tactics. I find that most fans and even many analysts treat these numbers as objective facts rather than model outputs. That distinction matters enormously.
Every stat carries the assumptions of the methodology that produced it. A possession figure built on passing time tells you something different from one built on ball-touch time. An xG model trained on one league’s shot data may not transfer cleanly to another competition’s defensive structures. When Lionel Messi’s xG consistently underperforms his actual goal output, that is not a flaw in Messi. It reflects that his shot selection and execution fall outside the historical patterns the model was trained on.
The transparency of methodology is the real test of a data provider’s credibility. Providers who publish their event definitions and model assumptions give analysts the tools to interpret data correctly. Those who do not force users to treat numbers as black boxes. For fans following the FIFA World Cup 2026 or tracking Champions League performance data, understanding what sits behind a stat transforms passive consumption into genuine analysis.
The future of football data will involve more automation, faster delivery, and finer granularity. But the human judgment layer will remain critical for years. The sport is too contextual, too fluid, and too dependent on split-second decisions for any current AI system to code reliably without oversight. The analysts sitting in front of those screens during a match are doing work that is far more skilled than it appears.
— Aria
Betsyscore: live football data built on the same metrics
Football statistics gain their full value when they are available in real time, organized clearly, and connected to predictive analysis. Betsyscore applies the same underlying metrics covered in this article to power its live match platform.

Live scores on Betsyscore refresh every few seconds, drawing from real-time data feeds across more than 200 competitions, including the Premier League, La Liga, Bundesliga, Serie A, and the Champions League. The platform’s AI predictions translate expected goals, recent form, and head-to-head records into win probabilities that update as matches progress. For analysts and fans who want to follow live match data with the context to interpret it, Betsyscore provides a fast, data-first environment built around the metrics that matter.
FAQ
How are football stats calculated in real time?
Real-time football stats combine human event coding and automated camera tracking, with data transmitting to broadcasters within 1–2 seconds of each on-ball event.
What is xG and how is it calculated?
Expected goals (xG) assigns each shot a probability of scoring based on shot distance, angle, assist type, and defensive pressure, drawn from historical shot data. A penalty typically carries an xG of 0.76–0.79.
Why do possession stats differ between broadcasters?
Possession is calculated using three different methods: passing time, ball-touch time, or event-count ratio. Each method produces different figures, which is why broadcast numbers can vary by 4–6 percentage points for the same match.
Do different data providers produce different statistics?
Yes. Opta and StatsBomb use different event definitions and shot models, so their figures for the same match will not always match. Those differences reflect methodology, not errors.
Can AI replace human analysts in football data collection?
Pure AI-based event coding is not currently reliable enough for elite professional football without human oversight. The hybrid model, combining specialist human coders with automated tracking, remains the industry standard.