How to Interpret Live Match Statistics Like a Pro

Live match statistics are defined as real-time data points, including expected goals (xG), possession percentage, shots on target, and pressing metrics, that update continuously as a soccer match unfolds. Fans who learn to interpret live match statistics gain a layer of understanding the scoreboard alone cannot provide. A team can dominate possession and generate an xG of 2.1 while trailing 0-1, a situation that tells a very different story than the score suggests. This guide explains which metrics matter most, how to spot momentum shifts, and how to build a practical analysis routine you can use during any match.
What are the essential live match statistics soccer fans should follow?
The five metrics that consistently reveal the most about a match in real time are xG, possession, shots on target, pressing stats, and player impact indicators. Each one answers a different question about what is actually happening on the pitch.
Expected goals (xG) measures the quality of every shot based on factors like distance, angle, and assist type. An xG value of 1.0 means a team created chances that, on average, should produce one goal. When a team’s xG climbs past 1.5 while the scoreline stays level, the data signals that a goal is statistically overdue. Tracking xG and possession every five minutes improves live insight accuracy compared to reading only the scoreboard.

Possession percentage is widely misread. High possession does not always mean control. A team sitting deep and absorbing pressure can hold 35% possession while limiting the opponent to low-quality chances. The nuance lies in where possession is won and lost, not just how much of it a team holds. The average player actually has the ball for only 1 minute, 49 seconds across a full 90-minute match. That figure puts possession percentages in perspective: the ball is constantly moving between players, and raw percentages can obscure the real territorial picture.
Shots and shots on target tell you about volume versus quality. A team firing 15 shots from outside the box is not necessarily threatening. Shots on target from inside the penalty area carry far more weight. Pair shot volume with xG to separate genuine pressure from speculative long-range efforts.
- PPDA (passes allowed per defensive action): A low PPDA score means a team is pressing aggressively. A high PPDA score means they are sitting off. This metric reveals pressing intensity before you can see it clearly on screen.
- Ball recoveries: The number of times a player wins the ball back in the opponent’s half signals high-press success.
- Key passes: A pass that directly creates a shot. Tracking key passes per 15 minutes shows which player is driving attacking threat.
- Turnovers in the final third: Losing the ball high up the pitch creates fast counter-attack opportunities for the opponent.
Pro Tip: Focus on shots on target and xG together rather than total shots alone. A team with 8 shots on target and an xG of 1.8 is far more dangerous than one with 14 total shots and an xG of 0.6.
How to read live match momentum and tactical shifts
Momentum in soccer is a tactical and psychological flow that becomes visible in the data before it shows up on the scoreboard. Momentum phases such as high-pressure periods often predict turning points before goals or cards occur. Knowing how to spot these phases separates informed fans from casual observers.
The game state, meaning the current scoreline, is the single biggest factor shaping how stats should be read. Raw data without game state context is noise. A team trailing by one goal will naturally push forward, inflate their shot count, and concede more space. Their possession may drop while their xG rises. Both outcomes are logical responses to the scoreline, not signs of collapse or dominance.
Here is a four-step process for reading momentum in real time:
- Set a 5-minute window. Shifts in 5–10 minute windows identify tactical changes earlier than final scoreboard results. Check the stats at the 30, 45, 60, 70, and 80-minute marks to spot patterns forming.
- Watch shot share. A rise in shot share from 40% to 70% over 10 minutes often signals an aggressive tactical change. That kind of swing is not random. It means a manager has made a decision.
- Check average pass length. An average pass length under 15 meters suggests a team is playing possession-based soccer. Over 25 meters indicates long-ball tactics, which typically appear when a team chases a goal late in the match.
- Track xG by half. Tracking stats by half exposes coaching adjustments and fitness advantages. A team that generates 0.4 xG in the first half and 1.6 xG in the second has clearly changed something at halftime.
Momentum is not just a feeling. It is a measurable shift in shot share, pressing intensity, and pass length that appears in the data minutes before the scoreboard reflects it. Analysts who track these patterns gain a predictive edge that pure scoreboard-watching cannot provide.
A concrete example: in Bundesliga matches, a tactical switch to more direct play produced a 1.2 xG increase in the first 15 minutes of the second half. That kind of xG jump is a reliable signal that a manager changed the game plan at halftime, not just that the team got lucky.
A step-by-step method to analyze live match data during a game
A structured approach to live match data analysis turns scattered numbers into a coherent picture. The method below works for any match across the Premier League, La Liga, Champions League, or any of the 200-plus competitions covered by Betsyscore.
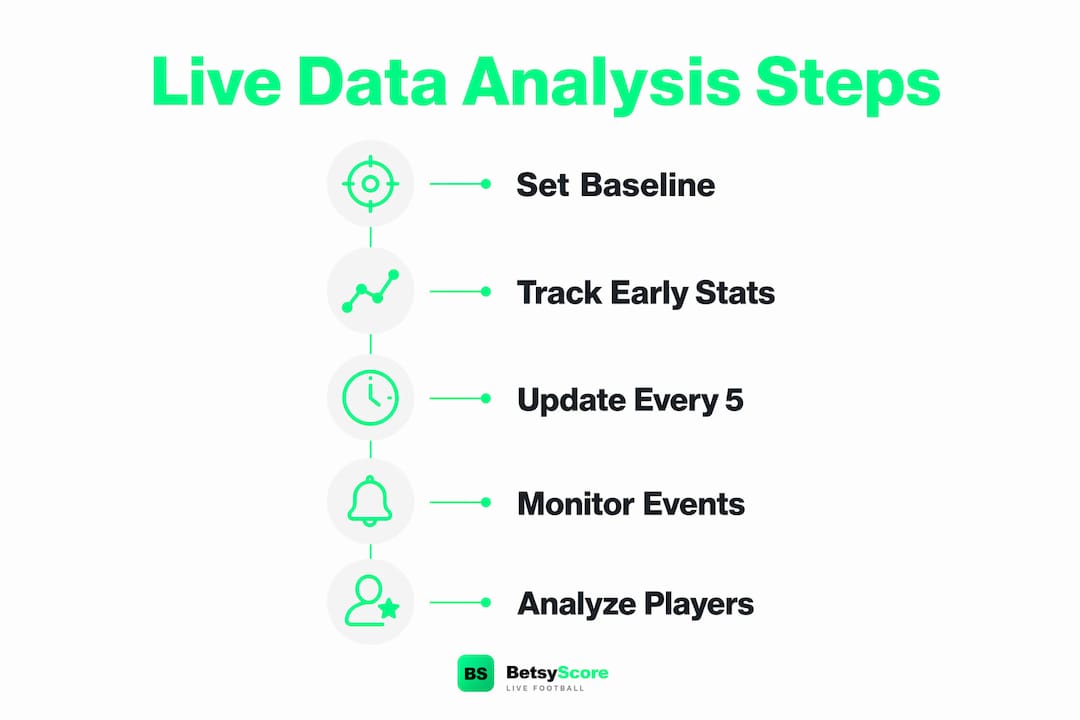
Before the match: Set a baseline. Note each team’s average xG per game, possession share, and shots on target from recent form. This gives you a reference point so you can immediately recognize when a team is underperforming or overperforming their typical output.
| Checkpoint | What to track | What it signals |
|---|---|---|
| Minutes 1–15 | Possession share, early shots | Which team is setting the tempo |
| Minutes 16–30 | xG accumulation, PPDA | Pressing intensity and chance quality |
| Minutes 31–45 | Shot share, key passes | Attacking momentum before halftime |
| Minutes 46–60 | Pass length, xG by half | Halftime tactical adjustments |
| Minutes 61–90 | Shot share swings, ball recoveries | Late-game momentum and fitness impact |
During the match, update your read every five minutes or after any key event such as a goal, red card, or substitution. Each of those events resets the game state and changes how every subsequent stat should be interpreted.
Pro Tip: When a substitution happens, immediately check the next five minutes of pressing stats and shot share. Managers often make tactical changes alongside personnel changes, and the data will confirm or deny what you think you saw.
Player-level stats add another layer. Ball wins and key passes per 15 minutes impact a team’s xG by 0.3 per period in Champions League data. A midfielder who wins the ball six times in 15 minutes and completes three key passes is directly driving attacking threat. Tracking one or two key players per team gives you a faster read on which side is controlling the game’s engine room.
After the match, compare your live observations to the final stats. This practice sharpens your ability to recognize patterns faster in future matches. The soccer match analysis checklist approach used by coaches translates directly to fan-level analysis with minor adjustments.
Common mistakes when interpreting live football statistics
Most errors in live stat analysis come from reading numbers without context. These are the five most common pitfalls and how to avoid them.
- Confusing possession percentage with control. A team can hold 65% possession while being tactically outplayed. Always pair possession with territorial data and xG to understand whether that possession is productive.
- Ignoring game state. A team trailing 0-2 in the 75th minute will show inflated shot counts and xG simply because they are chasing the game. Those numbers do not reflect their actual quality. Game state meaningfully alters how every statistic should be weighted.
- Over-relying on a single metric. No single stat tells the full story. xG without shot location context, possession without pass accuracy, and pressing stats without defensive shape data all produce incomplete pictures.
- Mistaking temporary spikes for momentum. A team can generate three shots in two minutes without that representing a genuine momentum shift. Look for sustained patterns across a 10-minute window before drawing conclusions.
- Trusting delayed data as real-time. Live stat feeds vary in update frequency depending on the platform. A stat that is 90 seconds old during a fast-paced sequence can be misleading. Use platforms that refresh data every few seconds to minimize this gap.
The true value of live stats comes from interpreting them alongside game state and tactics rather than reading raw numbers alone. That principle eliminates most of the mistakes listed above.
Key Takeaways
Reading live match statistics accurately requires combining real-time metrics like xG, possession, and shot share with game state context to reveal tactical shifts and momentum before the scoreboard reflects them.
| Point | Details |
|---|---|
| xG is the most reliable live metric | Track expected goals every five minutes to measure chance quality beyond the scoreline. |
| Game state shapes every stat | Always adjust your interpretation based on the current scoreline and time remaining. |
| Shot share signals tactical changes | A jump from 40% to 70% shot share over 10 minutes confirms an aggressive tactical shift. |
| Player stats drive team xG | Ball wins and key passes per 15 minutes directly raise a team’s expected goals output. |
| Avoid single-metric conclusions | Combine xG, possession, pressing stats, and pass length for an accurate live picture. |
Why live stats changed how I watch soccer
The first time I tracked xG in real time during a Champions League match, the scoreboard read 0-0 at halftime. The xG read 2.3 to 0.4 in favor of one side. The second half ended 3-0. That experience made me realize how much information the scoreboard withholds.
What I find most underrated is pass length as a tactical indicator. Most fans watch the ball. Watching average pass length shift from 18 meters to 28 meters over a 10-minute window tells you a manager has changed the game plan before the commentators notice. That kind of early signal is genuinely useful for understanding what is about to happen.
The mistake I see most often is fans treating possession as a proxy for dominance. Possession is a means, not an end. A team can hold 70% possession and generate 0.3 xG. That is not control. That is recycling the ball without purpose. Once you separate possession from productivity, your read on a match improves significantly.
Live prediction models that combine score, personnel, momentum, and conditions update win probabilities continuously. Using a platform that surfaces those probabilities alongside raw stats gives you a complete picture rather than fragments. The data tells a story. Learning to read it is the skill.
— Aria
Betsyscore brings live match data together in one place
Fans who want to apply these techniques during an actual match need a platform that keeps pace with the game.

Betsyscore delivers live scores and AI predictions that update every few seconds, with win-probability percentages built from xG, recent form, and head-to-head records. The platform’s momentum read shows which side is on top minute by minute, covering the Premier League, La Liga, Bundesliga, Serie A, the Champions League, the FIFA World Cup 2026, and more than 200 competitions worldwide. Fans tracking the metrics covered in this article can follow them all in one place at Betsyscore live, with instant stats, live lineups, and player profiles available throughout every match.
FAQ
What does xG mean in live match statistics?
Expected goals (xG) measures the probability that a shot results in a goal based on factors like distance, angle, and assist type. A value of 1.0 means a team created chances that should produce one goal on average.
How do I read live match momentum during a soccer game?
Track shot share and average pass length in 5–10 minute windows. A shot share jump from 40% to 70% or a shift to longer passes over 25 meters signals a tactical change and a momentum shift.
Why does possession percentage mislead fans?
Possession percentage does not measure chance quality or territorial control. The average player holds the ball for only 1 minute, 49 seconds per match, so high possession can simply mean slow, low-risk recycling rather than genuine attacking pressure.
How often should I check live stats during a match?
Check key metrics every five minutes and immediately after goals, red cards, or substitutions. Each of those events resets the game state and changes how subsequent statistics should be interpreted.
What is the biggest mistake fans make with live football stats?
The most common error is ignoring game state. A team trailing by two goals late in the match will naturally show inflated shot counts and xG simply because they are chasing the game, not because they are the better side.