Compare Provider Counts: Progressive Passes Explained for Analysts
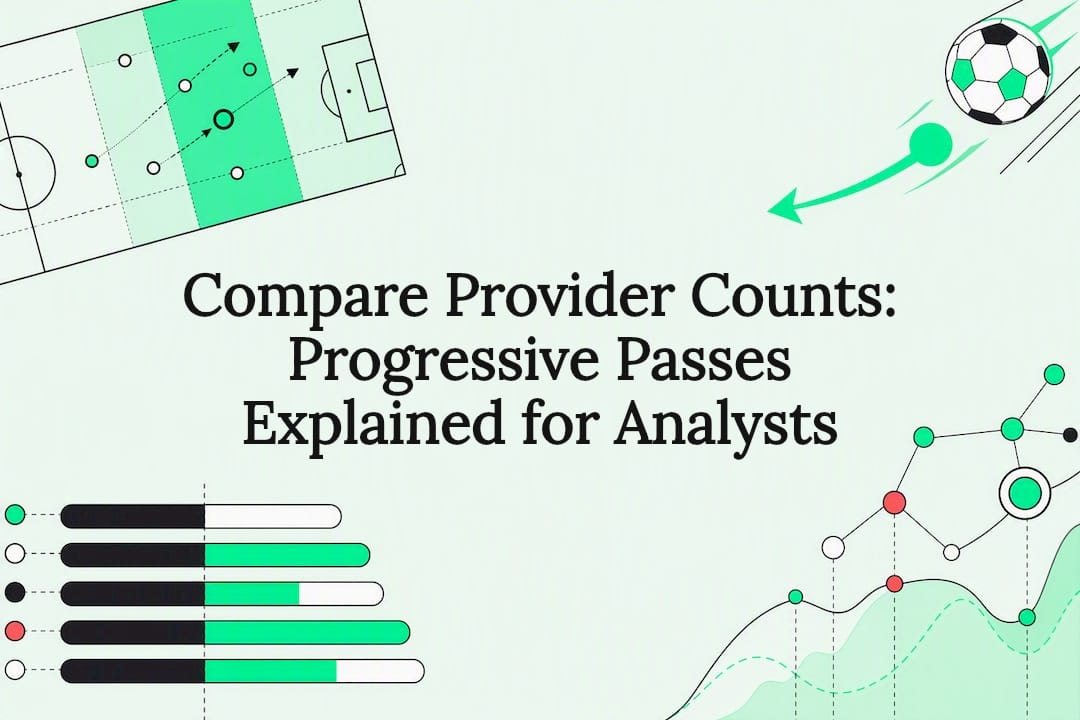
A progressive pass is a completed pass that moves the ball a meaningful distance closer to the opponent’s goal, measured in a straight line rather than along the ball’s actual path. Distance thresholds vary by data provider, which is why raw counts from different sources rarely line up. The metric exists to quantify one thing: how much a player advances his team toward goal through passing, independent of whether that pass leads to a shot.
TL;DR:
- Different data providers use varying thresholds and units, so users must verify the measurement method before comparing progressive-pass totals.
- Progressively advanced passes are most meaningful when combined with other metrics like pass accuracy, carries, and expected assists to assess attacking contribution.
- High progressive-pass counts alone can be misleading without context, such as pressure levels, pitch location, and subsequent actions that determine actual danger.
- Tactical styles significantly influence progressive-pass profiles, with possession teams favoring short build-up and counter-attacks relying on long diagonal or driven passes.
- BetsyScore’s live tracking offers real-time progressive-pass data during matches, helping to identify key playmakers and evaluate progression trends instantaneously.
Table of Contents
- What Is a Progressive Pass? The Formal Definition and Thresholds
- How Opta, FBref, StatsBomb, and Wyscout Measure Progressive Passes Differently
- Progressive Carries, Passes Received, and Through Balls: How They Connect
- Why Progressive Passes Matter for Scouting and Team Analysis
- What Progressive Passes Don’t Tell You
- Reading Progressive-Pass Numbers: Examples and Quick Visual Checks
- Where to Find Progressive-Pass Stats on BetsyScore
- Historical Development of the Progressive Pass Concept
- Technical Challenges in Capturing Progressive-Pass Data
- How Progressive Passes Relate to Match Outcomes
- Examples of Progressive Passing Across Different Playing Styles
- The Smartest Way to Use Progressive-Pass Data
- Track Progressive-Pass Leaders in Real Time on BetsyScore
- Sources
- FAQ
What Is a Progressive Pass? The Formal Definition and Thresholds
Understanding progressive passing starts with the rule that made it measurable. Wyscout’s methodology sets the industry’s most cited standard: a pass qualifies as progressive if it advances the ball a significant distance closer to goal, with the required distance varying depending on the zone the pass starts and ends in, being longer in the defensive half and shorter nearer to goal.
That sliding scale matters because “closer to goal” isn’t measured along the pass trajectory. It’s the straight-line distance between the ball’s location and the center of the target goal, before and after the pass. A cross-field diagonal from a center-back can rack up distance fast, while a short give-and-go near the box needs far less ground to qualify, since the threshold shrinks the closer play gets to goal.
Two other rules shape what actually gets counted:
- Success requires a teammate’s touch. A progressive pass only registers if the next touch on the ball belongs to a player on the same side. A pass that travels the right distance but gets intercepted doesn’t count.
- Set pieces are excluded. Corners, throw-ins, and free kicks are stripped out of most progressive-pass counts to stop long restarts from inflating a player’s numbers.
Other providers apply their own versions of this logic, which the next section unpacks.
How Opta, FBref, StatsBomb, and Wyscout Measure Progressive Passes Differently
No two data providers count progressive passes identically, and that gap trips up more comparisons than most fans realize. Wyscout’s tiered meter-based system is one model. StatsBomb takes a simpler approach, defining a progressive pass as any completed open-play pass that closes at least 10 yards of distance to goal, with no zone-based sliding scale. FBref, which pulls from Opta’s underlying data, often applies a comparable yard-based cutoff, though some versions use a “one-third of remaining distance” rule instead of a fixed number.
The practical differences boil down to a few variables:
- Meters versus yards as the unit of measurement
- A flat distance threshold versus a zone-dependent sliding scale
- Whether the calculation uses percentage-of-remaining-distance rules near the byline
- How each provider handles passes that start or end in a team’s defensive third
Every methodology page states its threshold and unit explicitly — that’s the single fastest way to confirm whether two numbers are actually comparable.
Because raw totals depend on minutes played and team style, serious analysis leans on two derived numbers instead: progressive passes per 90 minutes, and accurate progressive passes as a percentage of attempts. Per-90 normalization strips out playing-time bias, so a substitute who logs 30 minutes isn’t unfairly compared against a player who starts every match. Before comparing two players across sources, check the provider’s unit of distance, its threshold structure, and whether set pieces are included. Skip that check and you’re comparing two different stats that happen to share a name.
Progressive Carries, Passes Received, and Through Balls: How They Connect
Progressive passes describe the passer’s contribution, but three related metrics fill in the rest of the picture. A progressive carry measures ball advancement on the dribble rather than the pass, and it typically uses a smaller distance requirement, often around 5 yards, since a carry inherently covers less ground per action than a long ball.
Progressive passes received flip the lens to the target rather than the passer, showing which players consistently get found in advanced spaces. Through balls are a specialized subset of progressive passing that splits the defensive line, and they overlap heavily with the broader category without being identical to it. Key passes measure something different entirely: any pass that leads directly to a shot, regardless of distance gained.
For scouting or match review, pair these metrics rather than reading anyone in isolation:
- Progressive passes per 90 plus pass accuracy percentage, to judge volume and reliability together
- Progressive carries alongside progressive passes, to separate dribblers from distributors
- Key passes and expected assists (xA) layered on top, to confirm progression is translating into scoring chances
Why Progressive Passes Matter for Scouting and Team Analysis
Progressive-pass data answers questions that traditional stats like completion percentage can’t touch. Club and broadcast analysts have adopted the metric widely because it surfaces players who break defensive lines even when their assist totals stay modest.
The clearest use case is roster-wide distribution analysis. Map progressive-pass counts across an entire squad, and a pattern emerges that functions almost like a fingerprint. If center-backs top the chart, the team is building out from the back and trusting its defenders to carry the ball forward under pressure. If central midfielders dominate the numbers instead, progression is running through midfield rather than around it.
That distinction has real scouting value:
- A center-back with a high progressive-pass rate signals comfort on the ball and a coaching setup that demands it
- A deep-lying midfielder leading the chart often points to a vertical playmaker role rather than a pure ball-mover
- Comparing progressive-pass leaders to pass-completion leaders can reveal very different names, since progression rewards territory gain over safe recycling
Pro Tip: Never trust a progressive-pass number in isolation. Pull up match video for the top five entries on any leaderboard and check whether those passes actually created dangerous situations, or just moved the ball into space that didn’t matter.
What Progressive Passes Don’t Tell You
A high progressive-pass count looks impressive, but it hides as much as it reveals. Two players can post identical numbers while contributing in completely different ways: one might be breaking lines under pressure into the box, the other recycling the ball forward against a team that’s already sitting back. The metric stops counting the moment the ball changes hands and says nothing about what happens next.
Before drawing conclusions from a progressive-pass number, work through this checklist:
- Check the pressure context. Was the passer under duress, or was this a low-risk pass against a passive defense?
- Note the pitch location. A progressive pass into a crowded midfield differs enormously from one splitting the back line.
- Look at the follow-up action. Did the progression lead to a shot, a lost possession, or a sideways reset?
- Consider the opponent’s defensive shape. Teams that sit deep concede more “progressive” passes by default, since there’s more open field to advance into.
- Cross-check with expected goals and expected assists to see whether the progression created real danger.
The safest practice combines per-90 normalization, accuracy percentage, and a video check before trusting any single leaderboard.
Reading Progressive-Pass Numbers: Examples and Quick Visual Checks
Context changes everything about what counts as progressive. A center-back’s diagonal switch from his own box to the opposite touchline can cover well over 30 meters of straight-line distance, clearing Wyscout’s toughest threshold easily even though the pass never enters dangerous territory. Compare that to a five-yard cutback inside the penalty area: it barely moves the ball at all, yet it clears the 10-meter attacking-third threshold because the scale shrinks near goal.
When scanning a per-90 bar chart, look for players who cluster together in the same band rather than fixating on the single top name, since that group usually shares a tactical role. A quick reference table helps frame typical per-90 output by role:
| Role | Typical progressive passes per 90 | What drives the number |
|---|---|---|
| Ball-playing center-back | 4 to 7 | Build-out responsibility, time on the ball |
| Deep-lying midfielder | 6 to 10 | Central progression, pressure resistance |
| Attacking winger | 3 to 6 | Fewer touches, higher-value final actions |
Live match statistics reward the same quick-scan approach: check the per-90 rate first, then the accuracy percentage, before drawing any conclusion mid-match.
Where to Find Progressive-Pass Stats on BetsyScore
Betsyscore surfaces progressive-pass data across three touchpoints built for fast reading rather than spreadsheet digging.
- Player profile pages show per-90 progressive-pass rates alongside accuracy percentage, updated as matches finish.
- Live match stats track progressive passing in real time during active fixtures, so you can watch a midfielder’s line-breaking output build across 90 minutes.
- Tournament leaderboards rank progressive-pass leaders across competitions, from the Premier League to the Champions League, making cross-league comparison faster than pulling raw provider exports.
Use these views for quick scouting checks and in-match reads. When you need to verify an unusual number or compare across outside sources, drop back into the provider’s own methodology page and pair it with video.
Historical Development of the Progressive Pass Concept
Progressive passing didn’t exist as a named stat until analytics providers needed a way to quantify forward-moving contribution that traditional completion percentage couldn’t capture. Early football analysis leaned almost entirely on raw pass counts and success rates, numbers that rewarded safe sideways circulation just as much as line-breaking risk.
The shift began as expected-goals models matured and analysts started asking a follow-up question: which passes actually set up the sequences that led to shots? For a detailed introduction on statistical modeling in football, see how a Poisson goal model predicts football match scores. Distance-to-goal became the obvious proxy, since it’s objectively measurable from tracking and event data without needing subjective judgment calls about pass “quality.” Wyscout’s tiered meter thresholds and StatsBomb’s flat 10-yard rule emerged from that same underlying instinct, arriving at different specifics through different modeling choices.
Public adoption accelerated once outlets like FBref made the numbers searchable for free, turning what had been proprietary club analytics into something broadcasters and fans could reference during a match. That accessibility mattered more than any single technical refinement. Once progressive-pass counts started appearing in broadcast graphics and post-match breakdowns, the term entered mainstream football vocabulary rather than staying confined to front-office analytics departments.
The concept keeps evolving. Some providers now weight progressive actions by the danger of the resulting field position rather than distance alone, a refinement that pushes the metric closer to outcome-based models like expected threat. That direction suggests progressive passing will keep splitting into more specialized sub-metrics rather than converging on one universal definition.
Technical Challenges in Capturing Progressive-Pass Data
Tracking every pass across a 90-minute match with the precision progressive-pass thresholds demand is harder than it looks. Event-data collection relies on either manual tagging by trained analysts watching broadcast footage, or optical tracking systems that log ball and player coordinates dozens of times per second. Both approaches introduce their own error sources.
Manual tagging depends on camera angle and broadcast quality, and a pass that looks progressive from one replay angle can measure differently once someone recalculates exact start and end coordinates. Optical tracking systems solve part of that problem with consistent coordinate capture, but they require expensive stadium infrastructure that isn’t installed at every venue, which is part of why lower-tier leagues often lag behind top competitions in data granularity.
Distinguishing a genuine progressive pass from a deflected shot, a blocked cross, or a miscontrolled through ball also requires clean event classification upstream, before the distance calculation ever runs. Get that classification wrong and the progressive-pass count inherits the error. Providers handle this with layered quality control: automated flagging for statistical outliers, followed by human review on borderline cases.
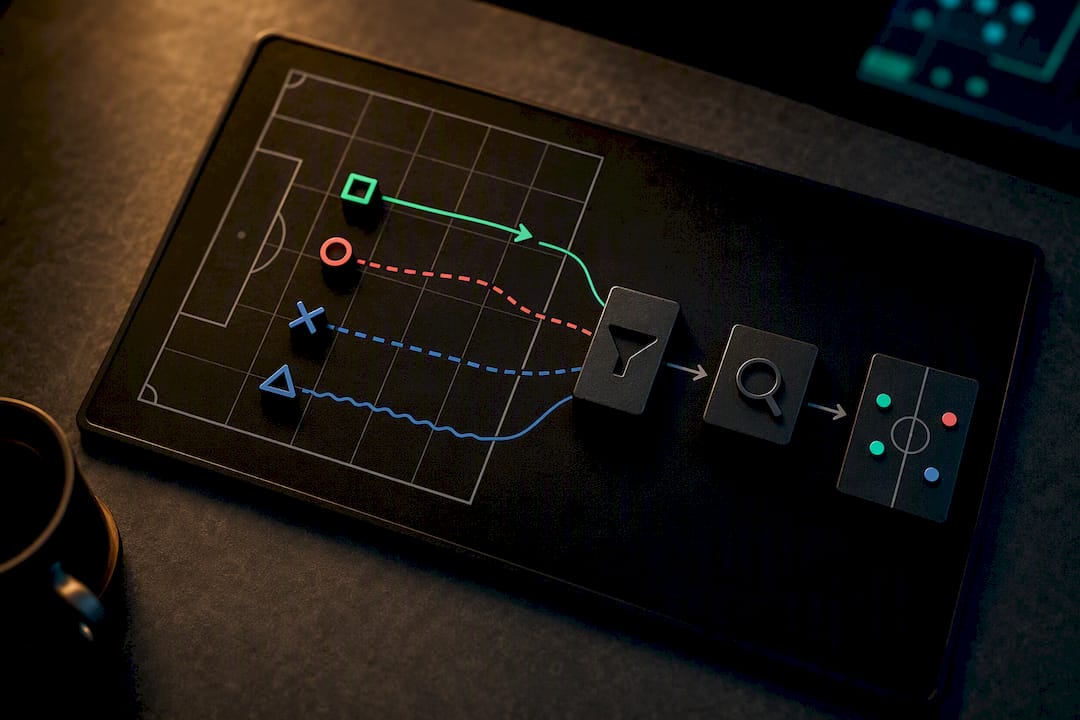
Straight-line distance calculation itself is computationally simple, but converting broadcast video into accurate pitch coordinates is the real bottleneck. That’s why understanding how football stats get calculated in the first place helps explain why two outlets covering the same match sometimes publish slightly different progressive-pass totals for the same player. The underlying coordinate data, not the threshold formula, is usually where the discrepancy starts.
How Progressive Passes Relate to Match Outcomes
Progressive passing correlates with attacking output, but the relationship isn’t a straight line from pass count to goals. Analysis tracing where goals originate has linked progressive passing sequences to a meaningful share of scoring buildup, reinforcing that line-breaking passes function as a leading indicator of attacking threat rather than a lagging one like assists.
Teams that generate high volumes of progressive passing tend to spend more time in advanced field positions, which naturally increases shot volume even when individual progressions don’t lead directly to a shot. That’s a structural effect, not a guarantee. A team can rack up progressive passes against a deep, passive defense without ever seriously threatening goal, since the metric rewards distance gained regardless of the danger created once the ball arrives.
The stronger signal comes from combining progressive-pass data with expected goals. When a team’s progressive-pass volume and its xG both trend upward together across a season, that alignment suggests the progression is genuinely translating into quality chances rather than empty territorial gain. When the two diverge, it’s usually a sign the team is advancing the ball into positions that look productive on a heat map but don’t generate real shooting opportunities.
At the individual level, players who rank high in both progressive passes per 90 and expected assists tend to be the ones directly responsible for chance creation, not just ball movement. That combination is a more reliable predictor of a player’s attacking value than either metric read alone.
Examples of Progressive Passing Across Different Playing Styles
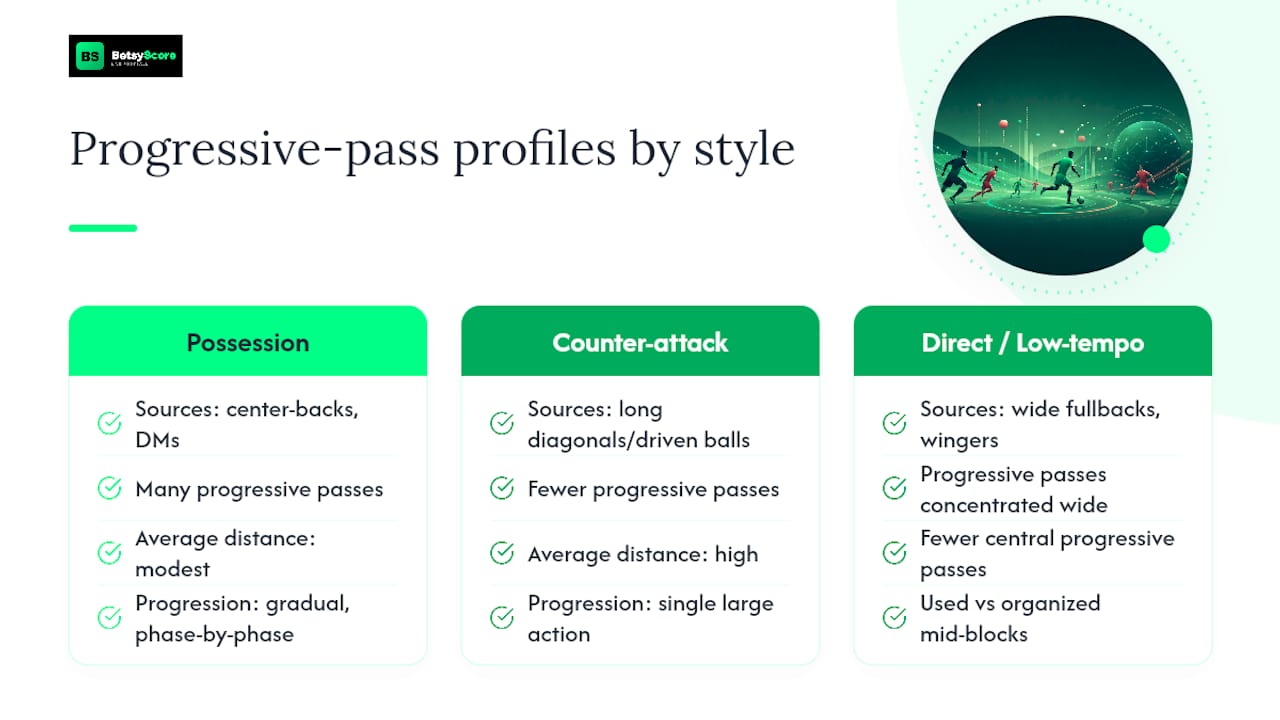
Progressive-pass profiles look drastically different depending on a team’s tactical identity, which is exactly why the insight that progressive passing is system-dependent rather than position-dependent holds up so consistently across leagues.
A possession-based side built around patient buildup, the kind associated with elite La Liga and Premier League clubs, tends to generate progressive passes from deep positions through center-backs and defensive midfielders who are comfortable receiving under pressure. The progression happens gradually, phase by phase, with multiple short-to-medium passes each clearing a modest distance threshold.
Counter-attacking teams produce a completely different profile. A single long diagonal or a driven pass through a transitioning defense can clear a massive distance threshold in one action, meaning counter-attacking sides often post fewer total progressive passes but higher average distance per pass. That pattern shows up frequently in Bundesliga and Serie A teams built around rapid vertical transitions rather than sustained possession.
Lower-tempo, direct-style teams in leagues with less possession dominance sometimes lean on progressive passing almost entirely through wide fullbacks and wingers, since central buildup carries more risk against organized mid-blocks. In that structure, the widest players on the roster, not the central midfielders, end up topping the progressive-pass leaderboard.
Recognizing which profile a team fits before comparing its players against another team’s roster prevents a common analytical mistake: judging a counter-attacking fullback’s progressive-pass total against a possession-based center-back’s total as though they’re playing the same game.
The Smartest Way to Use Progressive-Pass Data
Progressive-pass numbers work best as a scouting and structural-fingerprinting tool, not as a standalone judgment of quality. Use the metric to find who a team trusts to break lines, then always pair that number with match video and a look at the provider’s own methodology page before drawing a conclusion.
— Aria
Track Progressive-Pass Leaders in Real Time on BetsyScore
Provider methodology pages explain the math behind progressive passes, but watching the numbers move during an actual match is where the metric earns its keep. BetsyScore’s live stats update progressive-pass counts, per-90 rates, and accuracy percentages as matches unfold, across the Premier League, La Liga, Bundesliga, Serie A, the Champions League, and more than 200 other competitions worldwide.

That real-time layer is the practical edge over digging through static provider exports after the final whistle. You can watch a center-back’s progressive-pass count climb during a match and immediately see whether it’s translating into shots by checking the AI-powered match predictions running alongside win-probability shifts. If you want to compare a specific player’s season-long progressive output against league leaders, the tournament leaderboards on Betsyscore make that a two-click check instead of a spreadsheet exercise. Pull up a live match right now and watch how progressive-pass leaders shift as the game develops.
Sources
- Progressive pass - Wyscout Glossary
- Progressive Passes and Carries: The Stats Behind Ball Progression — SoccerAnalytics
- Progressive Passes Metric Explained | FBPlot | FBPlot
- Explained: Progressive Passing and Through Balls — FootTheBall
FAQ
What counts as a progressive pass?
A progressive pass is a completed pass that advances the ball a set distance closer to the opponent’s goal, measured in a straight line to the center of the goal. Thresholds vary by provider, from Wyscout’s tiered 30/15/10-meter system to StatsBomb’s flat 10-yard rule, and the next touch must belong to a teammate for it to count as successful.
What are the three types of passes in soccer commonly tracked in analytics?
Analytics generally separate passes into progressive passes (advancing the ball toward goal by a set distance), key passes (leading directly to a shot), and through balls (splitting the defensive line into space behind it). Standard completed passes that don’t meet any of those criteria are tracked separately as general possession passes.
What position gets the most progressive passes in soccer?
There’s no single position that leads every team, since progressive-pass volume depends more on tactical role than position alone. Ball-playing center-backs top the chart on possession-based teams that build from the back, while deep-lying midfielders or wide fullbacks lead on teams that progress through the middle or the flanks instead.
How do progressive carries differ from progressive passes?
Progressive carries measure ball advancement on the dribble rather than through a pass, and they typically use a smaller distance threshold, often around 5 yards, since a single carry usually covers less ground than a long pass.
Where can I check progressive-pass stats for current matches?
Betsyscore displays progressive-pass data on player profile pages, live match stats, and tournament leaderboards, updated as matches are played across major competitions including the Premier League and Champions League.