Trust xG Per 90 After 900 Minutes: Read Premier League Leaderboards

xG per 90 measures the average quality of scoring chances a player or team generates per full match, normalized for minutes played rather than raw goal counts. Premier League forwards leading the metric typically sit in a moderate to high range in a given season, while wide attackers and creative midfielders usually have somewhat lower values. The number matters because it isolates chance quality from finishing luck, letting you judge whether a scoring run is sustainable or about to fade.
TL;DR:
- Players’ xG per 90 values are highly influenced by shot quality, role, and sample size, with reliable insight emerging after about 900 minutes played.
- Penalty and set-piece shots can inflate raw xG totals, so non-penalty xG provides a clearer picture of open-play chance creation.
- Variations between providers’ models arise from differences in included shot variables, weighting, and sample periods, requiring careful comparison.
- High xG per 90 indicates good chance creation, but watching for heavy shot volume and shot placement is key to confirming genuine scoring potential.
- Real-time xG tracking can identify under- or overperformance during matches, offering a tactical edge over traditional goal counts.
Table of Contents
- What Does xG Per 90 Actually Measure?
- How Shot Data Becomes an xG Per 90 Number
- What Counts as a Good xG Per 90 Number?
- How Analysts, Fantasy Managers, and Bettors Actually Use It
- Where xG Per 90 Can Mislead You
- Where to Find Reliable xG Per 90 Data
- How Betsyscore Puts xG Per 90 to Work
- A Real Example of Reading the Number Right
- See xG Per 90 Live on Betsyscore
- Sources
- FAQ
What Does xG Per 90 Actually Measure?
Expected goals, or xG, assigns each shot a probability between 0 and 1 that it results in a goal, based on where it was taken from and how it was struck. Summed across every shot a player takes in a match or season, that produces a total xG figure. xG is the probability that a shot will result in a goal based on shot characteristics and context, and that shot-by-shot foundation is what separates xG from simpler counting stats like shots on target.
xG per 90 takes that season total and standardizes it. The formula divides total xG by minutes played, then multiplies by 90, so a substitute who plays 450 minutes can be compared fairly against a starter who plays 2,700. Without that step, a player who comes off the bench for 20 minutes a game would almost never appear near the top of any chance-creation list, regardless of how sharp his instincts are.
Three variants show up constantly on stat pages, and mixing them up leads to bad conclusions:
- xG: the raw total, including penalties and set pieces, summed across every shot attempt.
- npxG (non-penalty xG): strips out penalty kicks, which carry a near-automatic conversion probability (roughly 0.76 in most models) and can inflate a player’s number without reflecting open-play skill.
- xGoT (expected goals on target) or PSxG (post-shot xG): a post-shot model that only evaluates shots that were actually on target, factoring in placement and power rather than pre-shot location alone.
Each variant answers a slightly different question. Raw xG per 90 tells you how many good chances a player generates. npxG per 90 tells you the same thing minus penalty inflation. xGoT tells you how dangerous a player’s shots were once struck, which is the number scouts lean on when judging finishing technique or a goalkeeper’s shot-stopping. Betsyscore’s player profiles break out several of these side by side so you’re never comparing a striker’s raw xG against another player’s non-penalty figure by accident.
How Shot Data Becomes an xG Per 90 Number
Every xG model starts with shot-level inputs, and the specific variables a provider includes explain most of the variation you’ll see between two sites reporting different numbers for the same player.
The core inputs almost every model uses:
- Distance to goal — shots inside the six-yard box carry probabilities often above 0.30, while shots from outside the box rarely clear 0.05.
- Shot angle — a central shot has a wider net to aim at than one from a tight angle near the touchline.
- Body part — headers convert at meaningfully lower rates than shots struck with either foot.
- Assist type — a through ball or a cutback typically produces a higher-value chance than a shot after a long, contested buildup.
- Whether it’s a rebound — second-phase shots after a save or block often get their own probability adjustment.
- Defensive pressure — the number and position of defenders between the shooter and goal at the moment of the strike.
Providers differ on which of these they include and how they weight them, plus the sample period they trained the model on. That’s why FBref, Opta, and StatsBomb numbers for the same shot can diverge slightly. Commercial APIs like Sportmonks document their metric type IDs and specify whether penalties and set pieces are included, which is exactly the kind of detail you want to check before comparing figures across two sources.
Turning shot-level data into a season xG per 90 figure works like this: say a forward accumulates 14.4 total xG across 1,800 minutes played. Divide 14.4 by 1,800, then multiply by 90, and you get 0.72 xG per 90. That’s a strong number for a Premier League striker, comparable to a genuine top-six forward in a productive season.
Pro Tip: Always check the minutes-played figure a stat table uses before comparing two players’ xG per 90. A site that counts only “starts” versus one that counts total minutes including substitute appearances can shift the per-90 rate by 5 to 10 percent for heavily rotated players.
What Counts as a Good xG Per 90 Number?
Context decides whether a number is impressive, and role is the biggest variable. A center forward generating a moderately high xG per 90 is performing at a high level. A winger posting a similar figure would be exceptionally dangerous for a wide player, as wide attackers typically produce lower-value chances from tighter angles and longer distances.
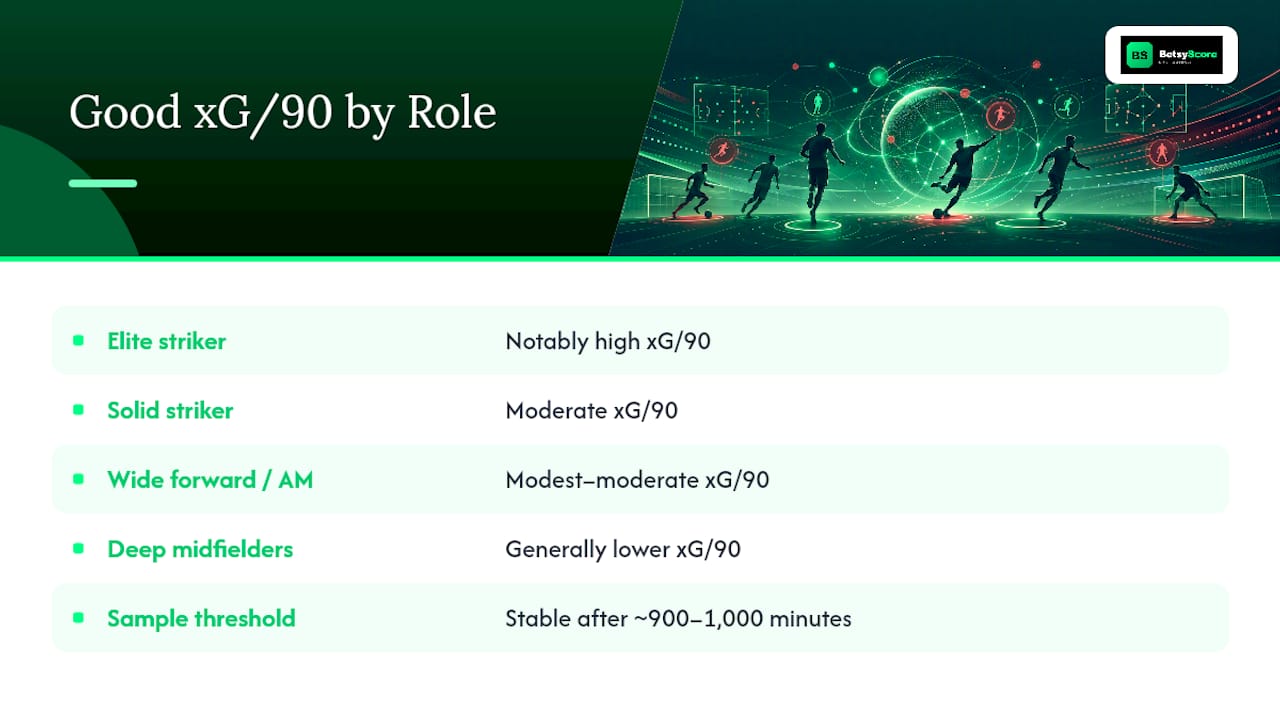
Rough qualitative benchmarks include elite strikers producing notably high xG per 90, solid strikers showing moderate values, productive wide forwards or attacking midfielders having modest to moderate figures, and deep-lying or box-to-box midfielders generally lower, as their contribution is more through expected assists than scoring chances.
A “big chance,” in most data providers’ terminology, refers to a shot with a high individual probability of scoring, generally something in the 0.30 to 0.40+ range for a single attempt, like an open goal from close range or a one-on-one with the keeper. One or two of these in a match can distort a small-sample xG per 90 figure dramatically, which is exactly why analysts treat early-season leaderboards with caution.
A single unconverted big chance can push a player’s match xG above 1.0 without a goal to show for it, and that one performance can swing his season-long per-90 average by a noticeable margin if his sample size is still small. Public leaderboards, including Premier League xG per 90 tables that require minimum-minute cutoffs, typically filter out anyone under roughly 450 to 900 minutes for exactly this reason. Below that threshold, a hot streak of three or four games can put a fringe player above established starters, and it says more about sample noise than sustained quality.
A safe rule of thumb: treat xG per 90 as stable once a player has cleared around 900 to 1,000 minutes, roughly ten to eleven full-match equivalents. Below that, read the number as an early signal, not a verdict.
How Analysts, Fantasy Managers, and Bettors Actually Use It
Scouting departments use xG per 90 to separate two very different skills: chance creation and finishing. A forward with high xG per 90 but goal totals that consistently trail his npxG per 90 is either an unlucky finisher or a below-average one, and separating those two explanations requires looking at his xGoT numbers over a longer sample.
Performance tracking is where the metric earns its keep during a season. Goal counts lag reality by weeks. A striker whose xG per 90 has quietly dropped from 0.60 to 0.35 over eight matches is heading for a drought even if his last two finishes happened to go in, and spotting that shift before the goals dry up is the entire point of watching the underlying number rather than the scoreline.
Fantasy football and betting markets lean on the same logic. Expected goals data captures chance quality that raw goal totals miss, which makes it a genuinely useful forecasting input rather than a backward-looking scoreboard stat. A player scoring well above his xG per 90 for a stretch of matches is usually a sell signal; one scoring well below it, especially if his shot locations remain good, is often a buy-low opportunity before the market catches up.
Practical ways to apply it:
- Compare a player’s actual goals to his npxG per 90 over a rolling 8 to 10 game window to spot regression candidates.
- Pair xG per 90 with expected assists (xA) per 90 for attackers who create as much as they finish, and check Betsyscore’s expected points breakdown for how these expected-value metrics stack together at the team level.
- Cross-reference shot volume (shots per 90) against xG per 90 to see whether a high figure comes from a handful of great chances or a steady stream of decent ones.
- Watch touches in the opposition box as a leading indicator; a rising trend there usually precedes a rise in xG per 90 by a few matches.
Where xG Per 90 Can Mislead You
No two providers calculate xG identically, and that inconsistency causes more confusion than any other issue with the metric. One site’s model might weight defensive pressure heavily; another might ignore it entirely and lean more on distance and angle. Before trusting a leaderboard, check what the provider’s documentation says it includes.
Common traps to watch for:
- Penalty inflation: a player who has taken three or four penalties in a season can show an xG per 90 that looks stronger than his open-play threat actually is. npxG strips penalties out specifically to correct for this.
- Set-piece distortion: corners and free kicks routed through one aerial target can inflate that player’s raw xG without reflecting broader chance creation.
- Small-sample noise: as covered above, anyone under roughly 900 minutes can post a misleadingly high or low figure off a handful of matches.
- Role mismatch: comparing a false nine’s xG per 90 against a poacher’s without accounting for shot volume and positioning tells you little.
- Model version changes: providers periodically retrain their models, which can shift historical figures retroactively, so a number pulled today might not match one pulled six months ago for the same season.
When the question shifts from “how many good chances did he get” to “how well did he finish them” or “how good was the goalkeeper’s stop,” raw xG per 90 stops being the right tool. That’s where post-shot metrics like xGoT and PSxG become more useful, since they condition on the shot actually reaching the target rather than just its starting position.
Pro Tip: If a player’s goals have wildly outpaced his npxG per 90 for an entire season, don’t assume he’s simply a “clinical finisher” and move on. Check his shot placement data or xGoT figures first. Sometimes it’s genuine elite finishing; sometimes it’s a run of favorable goalkeeper errors that won’t repeat.
Where to Find Reliable xG Per 90 Data
Three broad categories cover most of where this data lives publicly. League and season stat tables from major analytics sites publish rolling xG per 90 leaderboards, usually filterable by position and minimum minutes. Analytics blogs and glossary sites explain methodology in more depth than a stat table ever will. Commercial APIs, meanwhile, let developers and serious analysts pull shot-level data directly for custom per-90 calculations.
Before trusting any provider’s numbers, run through this checklist:
- Does the documentation disclose which shot-level variables feed the model (location, body part, assist type, defensive pressure)?
- Are penalties and set pieces flagged separately, or folded into one blended total?
- What’s the minimum sample period, and how often is the data refreshed?
- Does the provider distinguish pre-shot xG from post-shot xGoT/PSxG?
For anyone pulling data programmatically, commercial providers like Sportmonks assign numeric metric type IDs to expected-goals fields and return both team and player-level breakdowns per fixture. Look for fields covering shot-level xG value, minutes played, and timestamp of each event.
To rebuild a per-90 figure from a raw shot export yourself:
- Pull every shot event for the player across the sample period, including its individual xG value.
- Sum the xG values to get a season or match-window total.
- Pull total minutes played for that same window, accounting for substitutions.
- Divide total xG by minutes played, then multiply by 90.
Preserving event timestamps and the team’s minute-count at the time of each shot matters more than it sounds. Get sloppy with substitution timing and your per-90 figure for a rotated player can be off by a meaningful margin.
How Betsyscore Puts xG Per 90 to Work
Betsyscore folds xG per 90 directly into its AI-powered match predictions, combining it with recent form and head-to-head records to generate win-probability percentages that update as a match develops. The platform’s momentum read draws on the same shot-quality data, showing which side is generating the better chances minute by minute rather than just tracking who’s ahead on the scoreboard.
Player profiles surface season-level xG per 90 alongside npxG splits, so you can spot penalty inflation at a glance. Betsyscore’s Premier League player ratings page is a fast way to see how attacking output stacks up across a full squad, updated as the season unfolds.
A Real Example of Reading the Number Right
Last season, one Premier League forward’s goal tally stalled for six straight matches while his xG per 90 actually climbed from 0.42 to 0.61 over that stretch. The chances were better than ever; the finishing simply hadn’t caught up yet. He scored four goals in his next three games once shot placement normalized.
The takeaway: when goals and xG per 90 disagree for a short run, trust the underlying shot quality over the scoreline, but only once the sample clears that 900 minute threshold.
— Aria
See xG Per 90 Live on Betsyscore
Reading a season-end xG per 90 table only tells half the story. Betsyscore shows the number building in real time, with live xG timelines that track chance quality shot by shot as a match unfolds, alongside AI-powered win probabilities that update as momentum shifts. That immediacy is the practical edge over a static leaderboard: you see the underperformance or overperformance forming during the match, not three days later when a stat site refreshes its tables.

Player profiles break out xG per 90, npxG, and recent form side by side, so you can check whether a hot scoring run is backed by genuine chance quality or riding a short streak of lucky finishes. Head to Betsyscore’s AI predictions to see the current match calculations, or pull up a live match now to watch the xG timeline move in real time.
Sources
- xG Explained
- xG glossary: every football analytics term explained | xG Calculator
- Expected Goals (xG) Explained: Metrics + API Guide
- What is expected goals? | Expected goals explained
FAQ
How much xG is considered a big chance?
A big chance typically refers to a single shot with an individual scoring probability above roughly 0.30 to 0.40, such as an open goal or a one-on-one with the goalkeeper, and most data providers track these separately from routine shots.
What is the highest xG without scoring?
There’s no fixed ceiling since it depends on the match, but a player can rack up an individual match xG well above 1.0 by missing several big chances in one game, and providers flag these performances specifically because they signal either poor finishing or bad luck that a full-season sample will usually smooth out.
How do I calculate xG per 90?
Sum a player’s total xG across a chosen period, divide that figure by their total minutes played, then multiply by 90, which normalizes the number for a full match regardless of actual playing time.
Who has the highest xG per 90 in football?
The leaders shift throughout a season and vary by competition, but Premier League tables generally show top strikers clustering in a moderate to high range of xG per 90 once minimum-minute filters are applied, with Betsyscore’s live player profiles tracking those figures as they update match by match.