6 Match Edge for Bettors: Football Form With xG, Momentum, Betsyscore
A form guide is a snapshot of a team’s recent match results, usually the last 4, 6, or 10 games, broken into wins, draws, losses, and goal difference. The single best signal to check first isn’t the win column. It’s the expected goals (xG) trend layered against a live momentum graph, since that combination separates teams playing well from teams simply getting results. This data is tracked in real time across many competitions.
TL;DR:
- Shorter form windows, such as last four matches, are highly volatile and prone to fluctuations from single incidents like red cards or deflections.
- Expected goals (xG) trends provide a more reliable indicator of team quality than results alone, especially when results diverge from underlying xG data.
- Momentum graphs and heat maps reveal whether a team is controlling play or merely benefiting from luck, helping identify fragile or genuine form.
- Comparing home and away form separately is crucial, as teams often perform differently in different venues, which impacts prediction accuracy.
- Live data sources like Betsyscore combine scores, xG, momentum, and tactical visuals to offer a comprehensive real-time assessment of team form.
Table of Contents
- What a Football Form Guide Table Actually Shows
- Metrics Beyond Results: What xG and Shot Data Reveal
- Reading Momentum Graphs and Heat Maps in a Form Guide
- How to Use a Form Guide: Heuristics, Red Flags, and a Fast Checklist
- Comparing Form Across Leagues and Choosing the Right Timeframe
- A Practical Walkthrough: Building a Live Form Snapshot With Betsyscore
- A Compact Routine for Following Form Live
- Get Live Form Data and AI Predictions With Betsyscore
- Sources
- FAQ
What a Football Form Guide Table Actually Shows
Open any form guide and you’ll see a row of letters and numbers that looks simple until you try to use it for a real decision. The standard columns are P (matches played), W, D, L, GF (goals for), GA (goals against), GD (goal difference), and Pts (points). Some platforms add a column for opponent strength, often shown as Opponents PPG (points per game), which tells you whether those five wins came against relegation strugglers or title contenders.
Here’s what each column is actually doing:
- P, W, D, L: the raw scoreline record over the sample window.
- GF/GA: attacking output versus defensive solidity, useful only in combination.
- GD: a single number that compresses attack and defense but hides which one is driving it.
- Pts: the outcome bettors care about most and the one most prone to distortion by a lucky bounce or a red card.
- Opponents PPG: context that tells you whether a form streak was earned against strong or weak opposition.
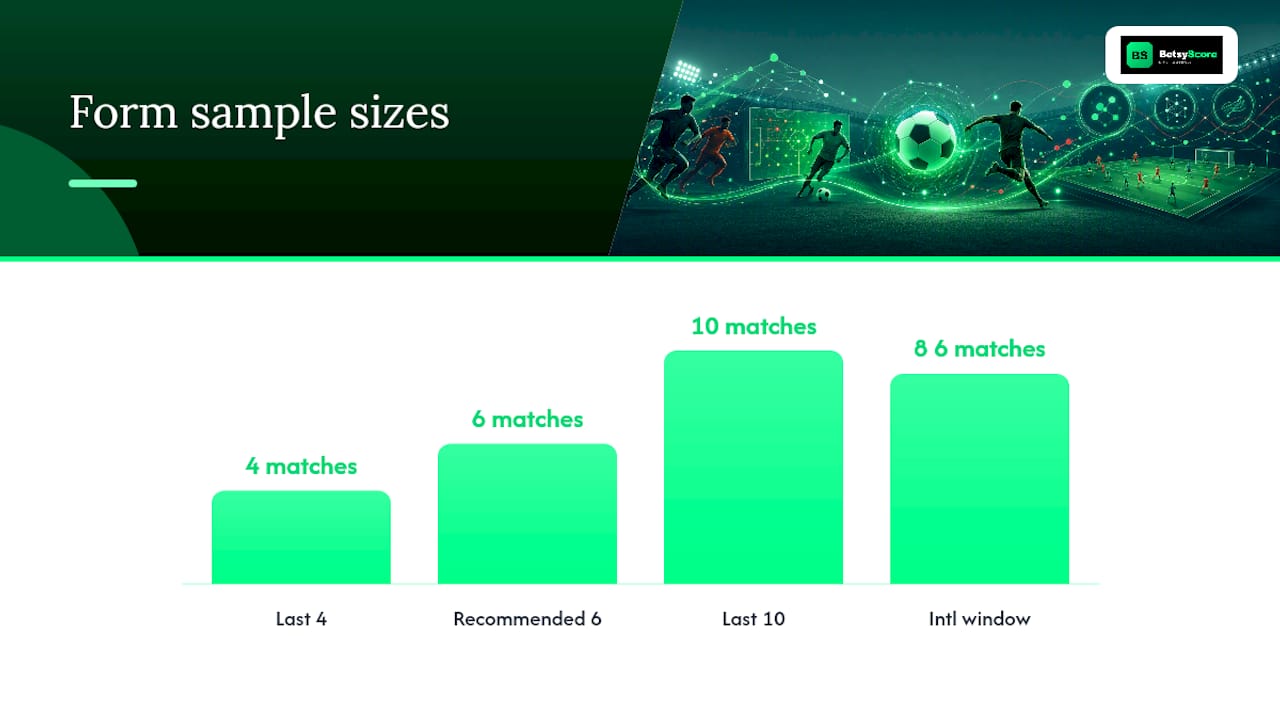
Timeframe choice changes the story completely. A last 4 form table reacts fast. It catches a manager change or an injury crisis within a week, but it’s also volatile. One deflected goal or one refereeing decision can flip a “hot” team into a “cold” one overnight. A last 10 window smooths that noise out and tends to reflect underlying quality more reliably, though it can lag behind a genuine tactical shift, like a new signing changing how a team presses.
Most serious football match analysis treats 6 matches as a workable middle ground for club football, long enough to filter out a single fluke result, short enough to still be current. International windows are the exception. With teams playing only 8 to 10 competitive matches a year, even a last 4 sample can span more than 12 months and mix in wildly different opposition levels.
Home and away splits matter more than most casual readers assume. A team’s combined form line might read “WWDLW,” which looks solid, but if three of those wins came at home against bottom-half sides and the loss came away at a mid-table team, the combined table is flattering a side that’s actually fragile on the road. Betsyscore’s post-match stat breakdowns let you isolate home and away form separately, which is the only way to catch that kind of split personality before it costs you a bad prediction.
Small samples lie in predictable ways. Watch for a form line built on penalty shootout wins in cup competitions counted alongside league points, own goals inflating a GF column, or a single 5-0 blowout skewing GD so heavily that four otherwise mediocre performances get buried under it. A team that’s actually 1-1-4 in “expected” terms but 3-1-2 on paper because of one outlier scoreline is a classic form-table trap, and it’s exactly the kind of gap that expected goals data is built to expose.
Metrics Beyond Results: What xG and Shot Data Reveal
Win, draw, loss columns tell you what happened. Expected goals tell you what should have happened, based on the quality and location of every shot a team takes or concedes. An xG above 2 from a match a team won 1-0 means they created enough high-quality chances to have won more comfortably, or were unlucky not to. A low xG from a match a team won by multiple goals means the scoreline was inflated, possibly by a hot streak of finishing that may not repeat.
Statistic Callout: Research on the predictive power of expected goals has found that persistent divergence between a team’s results and its underlying xG numbers is a stronger predictor of future regression than any short-term winning or losing streak, according to a PMC study on expected goals and performance. Analysts generally need at least 900 minutes of match data, roughly 10 full games, before per-90 metrics stabilize enough to trust.
That single finding should reshape how you read a form table. A team riding five straight wins while their xG trend is flat or declining is a textbook regression candidate. The results look great; the underlying performance says otherwise. Betting markets are often slow to price this in, which is exactly why bettors who track xG trends alongside results tend to spot value before it disappears.
A handful of metrics matter more than the rest when you’re trying to gauge sustainable form:
- xG per 90: strips out minutes played and red-card chaos, giving you a clean rate stat for comparing teams across different fixture loads.
- Shots and shots on target: a team generating fewer shots but the same goal tally is likely overperforming; more shots with the same goals suggests they’re due a positive correction.
- PSxG (post-shot expected goals) and goals prevented: measures a goalkeeper’s shot-stopping quality independent of the defense in front of them, which matters when a clean sheet run might be about the keeper, not the back four.
- xG difference (xGD): the attacking equivalent of goal difference, but built on quality of chances rather than final scorelines.
Betsyscore’s goalkeeper PSxG breakdown is worth a look if you want to see how this plays out at the individual level. A goalkeeper posting strong goals-prevented numbers over a run of matches is a genuine defensive asset, separate from whether the team in front of them is having a good run. Conflating the two is one of the most common mistakes in reading team form, and it’s an easy one to fix once you know to check the split.
The practical takeaway: a form table tells you the scoreboard story. xG trends tell you whether that story is likely to keep being written the same way.
Reading Momentum Graphs and Heat Maps in a Form Guide
Numbers compress a match into a handful of digits. Visuals show you the shape of the game, and that shape often contains information a stat line can’t capture at all.
A momentum graph plots which team is controlling play, minute by minute, based on possession value, territorial dominance, and chance creation as the match unfolds. A team that spends 70 of 90 minutes with the momentum needle tilted in their favor but loses 1-0 to a stoppage-time counter has a very different form profile than a team that wins 1-0 by sitting deep and absorbing pressure the entire match. The scoreline is identical, but the underlying performance is not. This is one of the clearest cases where live match statistics tell a truer story than the final table.
Heat maps add a second layer: where on the pitch that control is happening. A team dominating possession in their own defensive third isn’t dominating the match, they’re being pinned back and playing safe. A team with heavy heat-map density in the opponent’s box, even without a corresponding goal tally, is generating the kind of pressure that tends to convert into goals over a longer sample. Professional tactical-analysis platforms build entire workflows around this distinction, using interactive heat maps and live tactical modules to flag exactly which zones a team is winning or losing.
When the table says one thing and the visuals say another, trust the visual, but understand why the gap exists first. A team with a strong recent record but a momentum graph that consistently shows them under pressure for long stretches is living dangerously. Their form is real on paper and fragile underneath it. That gap is often the first place a genuine form correction shows up before the standings catch up.
- Check the momentum graph for the last 3 to 4 matches, not just the most recent one, to see if a pattern or a one-off is at play.
- Cross-reference heat map pressure zones with where goals are actually being scored or conceded.
- Treat a single result that contradicts the momentum trend as noise; treat three in a row as a signal.
Pro Tip: Before kickoff, glance at a team’s last two momentum graphs rather than just their W/D/L line. A side that keeps generating spells of sustained pressure without scoring is usually closer to a breakout performance than the table suggests.
For pre-match prep, prioritize the trend across multiple matches. For in-play decisions, prioritize the live momentum shift in the game you’re actually watching, since a team that starts slow but seizes control after the 60th minute is telling you something the halftime score won’t.
How to Use a Form Guide: Heuristics, Red Flags, and a Fast Checklist
Reading a form guide well isn’t about memorizing every column. It’s about running a short mental checklist that filters out noise before it influences your read on a match.
Start with four heuristics that apply to nearly every fixture:
- Weigh the opponent, not just the result. A win against a team sitting bottom of the table tells you far less than a draw away at a top-four side.
- Check the xG trend before trusting the points column. A team with points but declining xG is a regression risk; a team without points but rising xG is an undervalued side.
- Look for tactical mismatches. A team that thrives against a low block can struggle badly against a high press, since tactical setup can override raw form entirely when a specific system exploits a team’s structural weakness.
- Factor in injuries and rotation. A form line built with a key striker in the lineup means little if that player is suspended or injured for the next match.
Certain patterns should make you slow down before trusting a form guide at face value:
- A short sample (fewer than 4 matches) driving a strong narrative.
- Results that consistently outperform xG over multiple matches in a row.
- One outlier scoreline (a 5-0 or a last-minute winner) skewing the whole sample.
- A team’s form built almost entirely on one competition type, like cup form bleeding into league expectations.
A workable pre-match checklist takes under a minute once you know where to look. Pull the last 6 matches, split home and away. Check the xG trend against the points trend, looking for divergence. Scan the momentum graph for the two most recent games. Confirm there’s no major injury or suspension changing the picture. Note the opponent’s own form and tactical tendencies before drawing a conclusion.
If any part of that process starts to feel less like analysis and more like chasing losses or betting past your limit, that’s worth pausing on. Organizations like BeGambleAware offer free, confidential support, and GambleAware and Gambling Therapy provide additional resources, including multilingual counseling, for anyone who wants help stepping back.
Comparing Form Across Leagues and Choosing the Right Timeframe
Form doesn’t travel evenly between competitions, and treating every league’s table the same way is a quiet way to make bad calls.
Top-tier leagues like the Premier League or La Liga feature deeper squads, tighter competitive gaps, and heavier rotation during congested fixture periods, which means a last 4 sample can be skewed by a manager resting starters for a cup tie. Lower-tier and smaller leagues often show wider quality gaps between top and bottom clubs, so form streaks tend to be more genuine reflections of ability, but they’re also more vulnerable to a single injury gutting a thin squad’s output.
Timeframe should match your purpose. A short-term bet on this weekend’s match calls for a last 4 to 6 match window, weighted toward the most recent fixtures and current lineup. A season-long performance review, the kind useful for assessing a manager’s trajectory or a club’s overall trend, benefits from a last 10 to 20 match sample that irons out early-season inconsistency or a rough patch after a managerial change.
Home and away splits deserve separate attention in cross-league comparisons too. A team with a dominant home record in a league where home advantage is historically strong looks very different from the same record in a league where away teams win nearly as often. Cup competitions add another wrinkle: a team parking their bus in a domestic cup tie against lower opposition, then playing expansively in the league, shouldn’t have those two form lines blended together.
- Never compare raw points-per-game figures across leagues without adjusting for competitive balance.
- Treat cup form and league form as separate datasets unless the fixture itself is a cup match.
- Check whether a “hot streak” spans a fixture congestion period, since rotation can inflate or deflate form artificially.
A Practical Walkthrough: Building a Live Form Snapshot With Betsyscore
Here’s a workflow that takes a few minutes and produces a genuinely useful pre-match read, using the same three-phase structure professional analysis platforms rely on: pre-match context, in-game monitoring, and post-match review, a framework Opta-powered systems use for exactly this reason.
Step 1: Choose your team and timeframe. Pull up the club on Betsyscore’s live scores hub and set your window, last 6 matches works well for most pre-match reads. Note the combined record first, then split it into home and away.
Step 2: Read the xG trend alongside the momentum graph. Betsyscore’s momentum graph uses possession value to show which side controlled each match minute by minute, and pairing that with the xG trend tells you whether recent results reflect genuine dominance or a run of fortunate scorelines. If the team’s points are climbing while their xG trend flattens, that’s your regression flag.
Step 3: Compare the opponent’s tactical profile and check the lineups. Before locking in a read, look at how the upcoming opponent has performed against similar styles. A team that’s been steamrolling possession-heavy sides might struggle against a compact, counter-attacking setup, and momentum patterns often reveal this kind of mismatch before it shows up in the scoreline. Confirm the live lineup once it’s posted, since a single absence at center back or in the front line can shift the entire calculus.
What this workflow uses is straightforward: live score updates that refresh continuously rather than on a delay, AI-powered predictions built from xG, recent form, and head-to-head history, and a momentum read that shows control shifting in real time. None of those three replace judgment, but together they cut down the guesswork that comes from relying on a bare W/D/L line.
Pro Tip: Run this same three-step check about 30 minutes before kickoff once starting lineups are confirmed, not the night before. A late injury or a surprise squad rotation can invalidate a form read that looked solid the day before.
A Compact Routine for Following Form Live
Most people overcomplicate form tracking by trying to absorb every stat a platform offers. A cleaner approach: check the same three things every time, in the same order, and skip the rest.
Before kickoff, the routine is short. Last 6 form, home/away split, and the xG trend against the points trend, in that order. If those three align, the form guide is trustworthy. If the points trend is climbing while xG is flat, that’s the one detail worth digging into further before trusting the table at face value.
During the match, the momentum graph gets more weight than anything else. A scoreline can lie for 90 minutes; sustained pressure rarely does. A team dominating the momentum read for a long stretch without scoring is usually close to breaking through, and that’s a more useful signal in the moment than the live score itself.
The takeaway worth carrying into every match: form tables are the headline, but xG trends and momentum visuals are the fine print, and the fine print is where the real information tends to live. Read both, and read them in that order, and the gap between what a table shows and what a team is actually doing gets a lot smaller.
— Aria
Get Live Form Data and AI Predictions With Betsyscore
Reading form tables by hand across a dozen leagues eats uptime most fans and bettors don’t have, and static tables go stale the moment a lineup changes or a match kicks off. The full picture is kept live by scores that refresh continuously, momentum graphs updating minute by minute, and AI-powered predictions built from xG trends, recent form, and head-to-head records, across many competitions.

If you’ve been running the pre-match checklist described above by hand, Betsyscore’s live scores page does the heavy lifting for you, surfacing the xG trend, momentum read, and home/away splits without needing five separate tabs open. Want the model’s own read on a matchup before kickoff? Check the AI predictions page for win-probability percentages built from the same underlying data this guide walks through. Open a match you’re following tonight and see how the live momentum graph compares to what the form table alone would have told you.
Sources
The claims in this guide draw on peer-reviewed research into expected goals and regression, professional match-analysis methodology, and tactical case studies. For deeper technical reading, see the PMC study on xG and predictive performance, Stats Perform’s match-analysis methodology, Live Match Analysis on heat maps and tactical visuals, and the Arsenal v Napoli tactical breakdown for a real-world example of how xG and shot data explain a narrow scoreline. Readers concerned about gambling habits can find support through BeGambleAware.
- Football Match Analysis Software | Opta Data & ProVision for Clubs
- PMC article on expected goals and predictive performance
- Live Match Analysis
- Arsenal v Napoli tactical analysis
- BeGambleAware
FAQ
What Is a Football Form Guide?
A football form guide is a summary of a team’s recent match results, usually shown as a sequence of wins, draws, and losses over the last 4, 6, or 10 games, often paired with goals scored and conceded.
How Many Matches Should a Form Guide Cover?
A last 6 match window works well for most pre-match reads, balancing recency against sample size, while season-long trend analysis benefits from a 10 to 20 match sample.
What’s the Difference Between a Momentum Graph and a Heat Map?
A momentum graph tracks which team is controlling play minute by minute across the match, while a heat map shows where on the pitch that possession and pressure are concentrated.
Where Can I Check Live Form Data Across Multiple Leagues?
Platforms like Betsyscore track live scores, xG trends, and momentum graphs across many competitions, giving fans and bettors a single source for real-time form tracking.