Football Results Prediction: What Fans and Bettors Need to Know
A football results prediction is a probabilistic forecast that assigns numerical likelihoods to each possible match outcome — win, draw, or loss — based on statistical models and historical data. The industry term for this practice is statistical football prediction, and it sits at the intersection of data science and sports analysis. Unlike gut-feel opinions, these forecasts use metrics like expected goals (xG), team form, and head-to-head records to estimate probabilities. Understanding what drives these numbers separates informed bettors from those who treat predictions as certainties.
What is a football results prediction built on?
A football match outcome forecast starts with raw data, not intuition. Analysts collect dozens of match variables before a single probability is calculated. The most important inputs include:
- Expected goals (xG): Measures the quality of each shot based on location, angle, and assist type. A team with an xG of 2.1 against a team with 0.8 xG is statistically dominant, regardless of the final score.
- Expected goals against (xGA): Tracks defensive exposure. A team conceding high-quality chances consistently will eventually give up goals, even if short-term results look clean.
- Shot location quality: Not all shots carry equal weight. A tap-in from six yards out scores far more often than a long-range effort, and xG models account for this difference precisely.
- Pressing intensity (PPDA): Passes Allowed Per Defensive Action measures how aggressively a team presses. High-press teams disrupt build-up play and generate turnovers in dangerous areas.
- Goalkeeper post-shot xG prevented: Separates goalkeeping luck from skill by comparing expected goals on target against actual goals conceded.
- Historical head-to-head records: Certain tactical matchups produce consistent patterns across seasons, and models weight these accordingly.
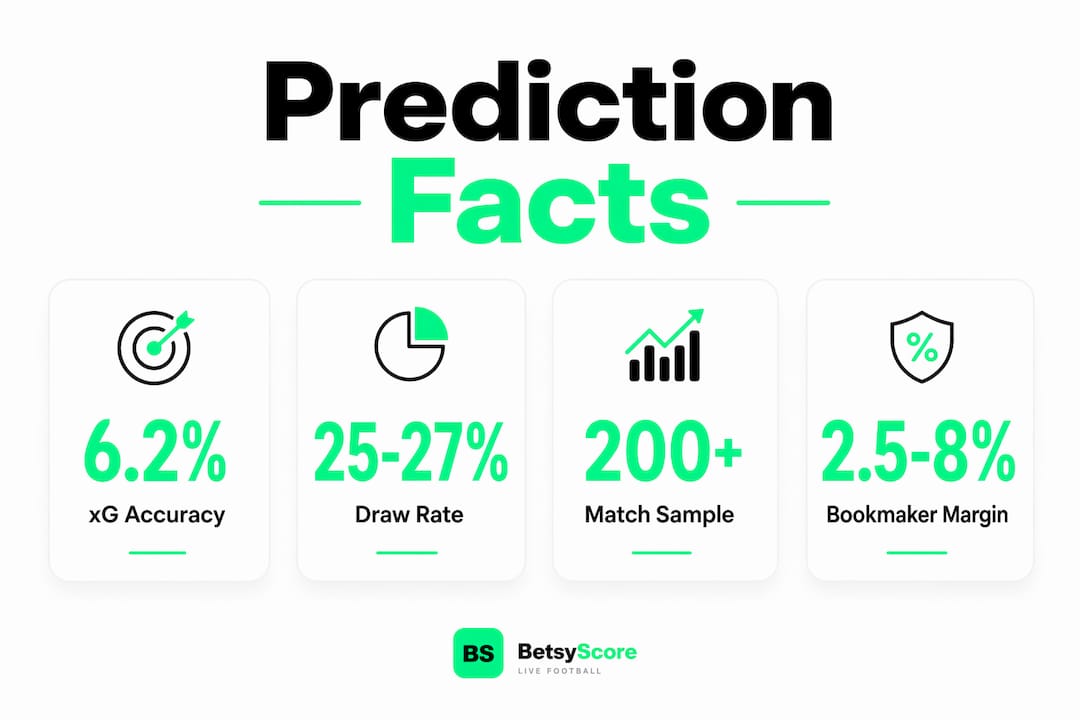
These data points feed into statistical models that generate probability distributions for each outcome. xG-based models outperform Elo-based systems by 6.2% in predictive accuracy across multiple Premier League seasons. That margin is meaningful at scale, where small edges compound across hundreds of predictions.
How do football prediction models handle uncertainty?

Football prediction is inherently probabilistic. Exact match results cannot be predicted with certainty due to the high-variance, low-scoring nature of the sport. A single deflection, a red card in the 10th minute, or a goalkeeper error can override every statistical advantage a team holds. Models do not eliminate this uncertainty. They quantify it.
The most common mathematical framework is the Poisson distribution. Analysts use a team’s expected goals rate to model the probability of scoring 0, 1, 2, or more goals in a match. By combining both teams’ distributions, the model generates win, draw, and loss probabilities. This approach handles the discrete, low-count nature of football scoring better than most alternatives.
Probability calibration over large samples is the key measure of prediction quality, not the outcome of any individual match. A model that assigns 60% win probability to a team is correct even when that team loses, provided it wins roughly 60% of the time across many similar predictions.
Calibration over large samples is what separates a reliable model from a lucky streak. Bettors who judge a model by one weekend’s results will always be disappointed.
Pro Tip: Never evaluate a prediction model on fewer than 200 matches. Short samples produce misleading accuracy figures that disappear once the dataset grows.
Value bets represent the practical application of this thinking. A value bet occurs when a model’s calculated probability for an outcome exceeds the implied probability embedded in bookmaker odds. If your model gives a team a 55% chance of winning, but the bookmaker’s odds imply only 45%, that gap is a potential edge worth tracking.
Bookmaker margins on 1X2 markets range from 2.5% to over 8%. That built-in overround means bettors need a genuine model edge just to break even, let alone profit.
Which football prediction techniques are most effective?
Three main approaches dominate the field. Each carries distinct strengths and limitations.
| Technique | Core method | Strength | Limitation |
|---|---|---|---|
| xG-based models | Shot quality and quantity data | High accuracy on goal-heavy matches | Underperforms on low-scoring games |
| Elo rating systems | Team strength rankings updated after each result | Simple, historically validated | Ignores in-match quality metrics |
| AI simulation (Monte Carlo) | Thousands of simulated match runs | Full probability distributions across all markets | Computationally intensive, requires large data inputs |
xG-based models outperform Elo-based systems by 6.2% in predictive accuracy. That advantage comes from measuring how teams play, not just whether they win or lose.
AI simulation models aggregate thousands of match outcome runs to generate full probability distributions. A single simulation of a World Cup 2026 match might run 10,000 iterations, producing betting lines for correct score markets, first goalscorer props, and total goals simultaneously. This depth of output is impossible with simpler methods.
Draw outcomes are statistically the hardest to predict accurately. Draws account for roughly 25–27% of matches in top European leagues, yet models consistently underperform on this specific outcome. That underperformance creates a structural inefficiency. Bettors who identify when a draw is undervalued by both models and bookmakers can find consistent edges.
Ongoing validation matters as much as model selection. Consistent bettors track at least 200 predictions to verify whether their edge holds over time. Anything less produces noise, not signal.
How can fans and bettors use football predictions effectively?
Applying a football match outcome forecast correctly requires a shift in thinking. The goal is not to pick winners. The goal is to identify when the probability assigned by your model differs meaningfully from the probability implied by the market.
- Focus on probability, not outcomes. A prediction that gives Team A a 65% win probability is useful information even when Team A loses. Judge the model over 200+ predictions, not match by match.
- Understand the market you are betting. Win/draw/loss (1X2) markets are the most liquid but carry the highest bookmaker margins. Correct score and player prop markets often offer better value because they are harder for bookmakers to price efficiently.
- Track your bets systematically. Record the model probability, the bookmaker odds, and the result for every bet. After 200 entries, patterns become visible. Without records, you are guessing.
- Account for bookmaker margins. With 1X2 margins ranging from 2.5% to over 8%, your model needs to be meaningfully better than the market to generate long-term profit.
- Avoid overconfidence in single-match predictions. Football’s low-scoring nature means upsets are frequent. A 70% probability still implies a 30% chance of the opposite outcome.
Pro Tip: Check AI-generated predictions on platforms like Betsyscore before each match. Win-probability percentages built from xG, recent form, and head-to-head data give you a structured starting point for your own analysis.
Common pitfalls include treating a high-probability prediction as a guaranteed outcome, ignoring team news and lineup changes, and chasing losses after a bad run. Lineup data matters significantly. A key striker missing through injury can shift xG projections by a full goal per match, which changes win probabilities by 10–15 percentage points in close matchups.
Understanding the underlying metrics also improves how fans watch matches. A team dominating xG but trailing on the scoreboard is not necessarily losing the game. Fans who shift focus from single-match outcomes to long-term probability calibration develop a more accurate picture of team quality over a season.
Key Takeaways
Accurate football predictions depend on probabilistic models calibrated over large samples, not single-match outcomes or gut instinct.
| Point | Details |
|---|---|
| xG drives accuracy | Expected goals models outperform simpler rating systems by a measurable margin across multiple seasons. |
| Calibration beats single results | Evaluate any prediction model across 200+ matches before drawing conclusions about its reliability. |
| Value bets require a model edge | A bet has value only when your model probability exceeds the bookmaker’s implied probability. |
| Draws are undervalued | Draw outcomes are the hardest to predict and often represent the best value in 1X2 markets. |
| Bookmaker margins are real | Margins of 2.5%–8% on 1X2 markets mean your edge must be genuine and consistent to matter. |
Why probabilistic thinking changed how I watch football
The biggest shift I have seen in football analysis over the past decade is not the arrival of new data. It is the gradual acceptance that uncertainty is the point, not a flaw to be fixed. Early prediction culture treated a model that “got it wrong” as a failed model. That framing was always incorrect.
What actually changed the conversation was xG. Once fans and bettors had a metric that measured shot quality independently of results, they could finally separate a team playing well from a team getting lucky. A side posting 2.5 xG per match but scoring 0.8 actual goals is not a bad team. It is an unlucky one, and the correction usually comes.
The ethical dimension of prediction communication also deserves attention. Presenting a 60% win probability as a “near-certain” outcome misleads bettors and damages trust in analytical work. The best prediction services state probabilities clearly and explain model limitations without overselling certainty. That standard is still not universal, and bettors should treat any service that claims high accuracy on individual matches with skepticism.
The fans and bettors who benefit most from prediction analysis are those who treat it as a long-term discipline. They are not looking for a shortcut to a winning bet this weekend. They are building a systematic understanding of how football actually works, one calibrated probability at a time. That mindset is what separates informed engagement from expensive guesswork.
— Aria
Betsyscore’s AI predictions and live match data
Betsyscore applies the same xG-based and AI-driven methodology described in this article to every match it covers, across more than 200 competitions worldwide.

The platform’s AI predictions deliver win-probability percentages built from expected goals, recent form, and head-to-head records, updated in real time as matches develop. For fans following the FIFA World Cup 2026, the Premier League, La Liga, or the Champions League, Betsyscore’s live scores and analytics provide the data layer needed to interpret predictions correctly. Whether you are tracking a single match or monitoring a full matchday, the platform puts calibrated probability data directly in front of you.
FAQ
What is a football results prediction?
A football results prediction is a probabilistic forecast that estimates the likelihood of each match outcome — win, draw, or loss — using statistical models, historical data, and metrics like expected goals (xG).
How accurate are football prediction models?
No model predicts individual matches with certainty. xG-based models outperform simpler Elo-based systems by 6.2% in accuracy, but reliability is best measured across 200 or more predictions, not single matches.
What is a value bet in football prediction?
A value bet occurs when a model’s calculated probability for an outcome exceeds the implied probability in bookmaker odds. That gap represents a potential long-term edge for the bettor.
Why are draws so hard to predict?
Draws account for roughly 25–27% of matches in top European leagues, yet prediction models consistently underperform on this outcome. The low-scoring nature of football makes the narrow margin between a draw and a one-goal result difficult to model reliably.
What data does an AI football prediction use?
AI prediction models use inputs including expected goals, shot location quality, pressing intensity (PPDA), goalkeeper performance metrics, recent team form, and head-to-head historical records to generate probability distributions across multiple betting markets.