Football Momentum Explained: What Shifts a Match's Flow
Football momentum is the sustained swing in a team’s attacking threat and win probability that separates a team in control from one merely surviving. It is both a tactical and psycho-emotional phenomenon: a goal, a key tackle, or a referee decision can trigger a cascade of confidence that reshapes how both sides play for the next ten minutes or more. Research confirms that momentum is non-random, tied to measurable increases in win probability across successive possessions, and linked to physiological changes including testosterone boosts and reduced stress-hormone levels in players experiencing a winning streak.
Understanding football momentum means recognizing its core components:
- Attacking threat differential: which team is generating dangerous sequences near goal
- Psychological state: player confidence, decision speed, and collective belief
- Tactical positioning: whether a team’s block is compact and forward or stretched and retreating
- Trigger events: goals, red cards, set-piece wins, and momentum-shifting referee calls
- Real-time tracking: platforms like Betsyscore deliver minute-by-minute momentum reads across more than 200 competitions worldwide
Table of Contents
- How is football momentum calculated using data-driven metrics?
- What do real match examples reveal about momentum shifts?
- How do broadcasters use momentum data to tell the story of a match?
- What does expert research say about momentum’s psychological and tactical effects?
- Betsyscore brings real-time momentum data to every match you watch
- FAQ
- Key Takeaways
How is football momentum calculated using data-driven metrics?
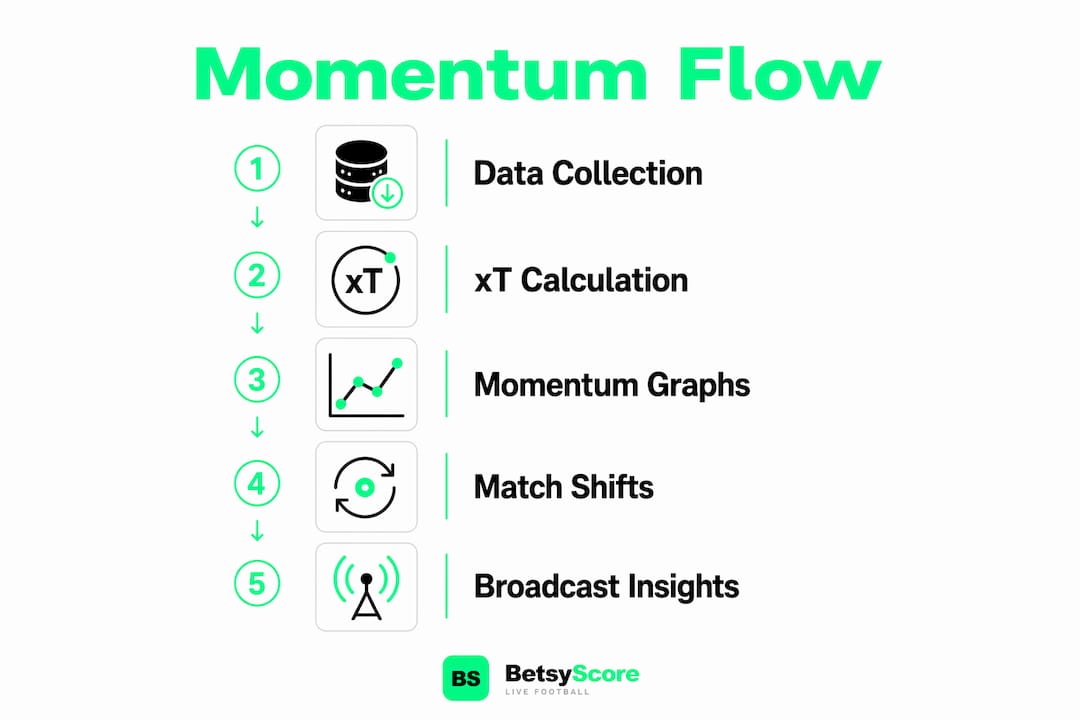
The most widely used metric for quantifying match momentum is expected threat differential, often abbreviated as xT. Data providers define xT as the probability that a goal will be scored within the next five actions from a given position on the pitch. A momentum chart plots this figure for both teams over time, showing which side held the greater attacking threat at each minute of the match.
Analysts and broadcasters build momentum graphs by aggregating possession sequences and weighting each action by its location and outcome. A ball played into the penalty area carries a higher threat value than a sideways pass in midfield. The chart then displays the differential between the two teams rather than an absolute pressure figure, which is why most momentum visualizations carry no Y-axis scale. That design choice reflects relative dominance, not raw volume of pressure.
The table below illustrates how momentum can swing across a hypothetical 90-minute match segment:
| Minute | Team A xT | Team B xT | Momentum Holder |
|---|---|---|---|
| 1–15 | — | — | Team A |
| 16–30 | — | — | Team B |
| 31–45 | — | — | Team A |
| 46–60 | — | — | Team B |
| 61–75 | — | — | Team A |
| 76–90 | — | — | Team B |
Key limitations analysts acknowledge:
- Momentum metrics capture threat sequences but not defensive organization or physical fatigue
- Charts are retrospective storytelling tools, not live predictive instruments
- A team can hold low xT while executing a deliberate low-block counter-attack strategy successfully
- Possession percentage alone does not determine momentum, as several high-profile upsets demonstrate
Pro Tip: When reading a momentum chart, focus on sustained blocks of dominance lasting ten or more minutes rather than isolated spikes. Short peaks often reflect a single set piece or long-range attempt, not a genuine shift in match control.
What do real match examples reveal about momentum shifts?
The 2023/24 FA Cup Final between Manchester City and Manchester United illustrates how possession and momentum can diverge sharply. City held 73% of possession and registered 18 shots to United’s 10. Yet United achieved an xG of 1.69 against City’s 1.35, winning the match by staying compact and exploiting transition. United’s second goal came from a rapid counter that created a 4v3 overload in City’s penalty area, a direct product of their defensive structure rather than sustained possession.
The Arsenal versus Manchester City Premier League fixture in September 2024 offers a different angle. Arsenal built momentum through a combination of direct runs in behind and set-piece threat, with a significant portion of their goals that season coming from set plays. After Arsenal took the lead, Leandro Trossard received a second yellow card. City’s momentum chart then showed a sustained increase in attacking threat through the entire second half, eventually producing the equalizer deep into stoppage time.
Observable signs of a momentum shift during live matches:
- The team gaining momentum pushes its defensive line higher and compresses space
- Players make more forward runs off the ball, even when their side is defending
- The opposition begins making backward passes under pressure rather than progressing the ball
- Substitutions by the trailing coach accelerate, signaling a tactical response to negative momentum
Pro Tip: Watch the team that just conceded, not the one that scored. How quickly they reorganize their defensive shape tells you whether the momentum shift is temporary or likely to extend.
How do broadcasters use momentum data to tell the story of a match?
Momentum charts have become standard across major broadcast partners and data providers, functioning primarily as narrative storytelling tools rather than precise predictive instruments. A viewer watching a match on television sees the chart confirm what they already sense: one team is pressing, creating chances, and controlling the tempo. The visual gives that feeling a number.
Broadcasters incorporate momentum data in several ways during live coverage:
- Overlaying rolling xT charts during halftime analysis to show which team controlled each phase
- Using possession heat maps alongside momentum graphs to explain tactical patterns
- Highlighting momentum inflection points, such as a red card or a penalty, with timestamped chart annotations
- Presenting momentum as a numerical confirmation of the commentator’s “eye test” observation
The critical caveat is that momentum data is retrospective. A chart shown at the 70th minute tells you what happened, not what will happen next. Fans who treat broadcast momentum visuals as predictive tools often misread the game’s likely direction. Understanding live match statistics in context, rather than in isolation, produces more accurate reading of a match’s actual state.
What does expert research say about momentum’s psychological and tactical effects?
Academic research confirms that momentum is a psycho-emotional state triggered by pivotal game events, shaping both player behavior and coaching decisions in measurable ways. Studies using NFL play-by-play data from 2002 through 2012 established that win-probability streaks are highly non-random, persisting even after controlling for fourth-quarter clock management effects.

Research on coaching behavior reveals a clear asymmetry. Positive momentum leads coaches to maintain their team’s organization and resist tactical changes, while negative momentum provokes more frequent substitutions and formation adjustments. Coaches are demonstrably more sensitive to negative events than to equivalent positive ones, a pattern consistent with cumulative prospect theory in behavioral psychology.
Physical and tactical signatures differ sharply between momentum phases. Teams in positive momentum phases display a compact, forward-positioned block with player runs directed toward the opposing goal. Negative momentum produces the opposite: a stretched, backward-retreating formation with disconnected individual actions and players focused on the referee rather than the ball.
Key research findings on momentum’s psychological dimensions:
- Positive momentum is paradoxically fragile; coaches manage it cautiously to avoid complacency
- Teams scoring a goal often enter a vulnerable period immediately afterward as defensive shape loosens
- Player tracking technology, as detailed by sports performance analysts, now enables real-time detection of these collective organization patterns
- Emotional regulation, not tactical genius alone, determines whether a team sustains or squanders momentum
Betsyscore applies these principles directly, using AI-driven analytics of expected goals, recent form, and possession data to generate a minute-by-minute momentum read across every covered match. That real-time layer gives fans and analysts the same data framework that performance scientists use, delivered at the speed of live football.
Betsyscore brings real-time momentum data to every match you watch
Football momentum explained in theory is one thing. Watching it move in real time, minute by minute, across the Premier League, La Liga, the Bundesliga, Serie A, the Champions League, and the FIFA World Cup 2026, is where the concept becomes genuinely useful.

Betsyscore tracks momentum live across more than 200 competitions, combining expected goals data, possession sequences, and recent form into a single, readable momentum indicator that updates as the match unfolds. The AI prediction engine layers win-probability percentages on top, so you see not just who is in control right now but how that control translates into likely outcomes. For fans who want to move beyond the scoreline and analysts who need data fast, live momentum tracking on Betsyscore delivers the full picture without delay. Check the AI predictions page before kickoff to see how momentum history and form factor into each match’s forecast.
FAQ
How is momentum used in football?
Momentum describes which team holds sustained attacking threat and psychological control at a given point in a match. Coaches use it to decide whether to maintain their tactical setup or make changes, while broadcasters use momentum charts to visualize match flow for viewers.
How is momentum calculated in football?
The most common method uses expected threat differential, measuring the probability of a goal being scored within the next five actions from each team’s possession sequences. These values are plotted over time to show relative dominance rather than absolute pressure.
Is momentum in football real?
Research using NFL play-by-play data from 2002 through 2012 confirmed that win-probability streaks are non-random and linked to physiological changes in players, supporting the view that momentum has genuine psychological and performance effects, even if its duration is typically short.
What is the momentum rule in football?
There is no formal rulebook definition of momentum. In analytical and coaching contexts, momentum refers to a sustained increase in a team’s win probability or attacking threat across successive phases of play, as defined by performance scientists and data providers.
Key Takeaways
Football momentum is a non-random, measurable phenomenon that shapes player behavior, coaching decisions, and match outcomes through sustained swings in attacking threat and psychological control.
| Point | Details |
|---|---|
| Momentum is non-random | Research on NFL data confirmed win-probability streaks are highly unlikely to occur by chance. |
| xT differential is the core metric | Expected threat differential measures which team poses greater scoring danger across each five-action sequence. |
| Coaching response is asymmetric | Positive momentum encourages tactical consistency; negative momentum triggers more frequent substitutions and changes. |
| Physical signatures are visible | Positive phases show compact, forward-positioned teams; negative phases produce stretched, retreating formations. |
| Betsyscore tracks it live | Betsyscore delivers minute-by-minute momentum reads across 200-plus competitions using AI-driven expected goals and possession data. |