AI Soccer Predictions: How They Work and How to Read Them

AI soccer predictions are statistical forecasts of a match result, expressed as probabilities for a home win, a draw and an away win. A model estimates those probabilities from data such as expected goals, recent form and head-to-head records. The output is a measure of likelihood, not a verdict on what will happen. This guide explains what the percentages mean, which data feeds them, how live forecasts update, how accuracy is measured and where the limits lie.
TL;DR
- An AI soccer prediction is a probability distribution across three outcomes (home win, draw, away win), and the three numbers sum to 100%.
- Models are built from engineered features such as expected goals, form and head-to-head history, then fitted with machine-learning methods.
- Live predictions recompute win probability as the match state changes, using goals, shots, cards and other events.
- Peer-reviewed work indicates that accuracy near 50% on match results can be normal, because football contains a large share of irreducible randomness.
- The best test of a forecast is calibration: whether outcomes assigned 60% happen about 60% of the time over many matches.
Table of Contents
- What AI soccer predictions actually are
- Which data the models use
- How models turn data into a pre-match forecast
- How live predictions change during a match
- How accuracy is measured
- The limits of AI soccer predictions
- How to read a prediction on BetsyScore
- Perspective: probabilities are a tool for thinking, not a promise
- A checklist for judging any AI soccer prediction tool
- FAQ
- Sources
What AI soccer predictions actually are
A prediction from an AI system is a forecast, not a pick. The academic description of the pi-football model, a Bayesian network built for English football, frames the output as a probability distribution over home win, draw and away win. The same structure is used by most modern tools.
An illustrative example (not a real match): a model might return 52% home win, 26% draw and 22% away win. Three readings follow from that:
- The home side is the most likely single outcome, but the model expects it to fail to win in 48% of comparable situations.
- A draw at 26% is a normal figure. Draws are a distinct outcome and are frequently undervalued by readers who think only in winners and losers.
- The favorite is not guaranteed. A 22% away win is roughly a one-in-five event.
Readers sometimes ask for a single predicted scoreline instead. Scoreline models exist and are built on goal distributions, but they sit on top of the same probability logic. BetsyScore publishes both: AI predictions for upcoming fixtures and predicted scorelines for every match.
Which data the models use
Prediction quality depends on inputs more than on algorithm names. Four families of data appear in most systems.
Expected goals
Expected goals (xG) assigns each shot a numerical value for its chance of becoming a goal. Providers calculate it differently, as proprietary versions use varying methods, so xG figures from two sources for the same match rarely match exactly. A team that creates 2.1 xG and concedes 0.8 over several matches is performing better than its raw results may suggest.
Recent form
Form summarizes the last several results, usually weighted so that the latest matches count more. Good models separate form against strong and weak opposition and account for home and away splits.
Head-to-head records
Historical meetings add context on stylistic matchups, though they carry less weight than current team strength. Squads change, and a result from six years ago says little about today’s lineups.
Event and tracking data
Advanced analytics such as Valuing Actions by Estimating Probabilities (VAEP) use event logs and tracking data to value individual player actions beyond simple outcome-based metrics. This is the layer that allows a model to say a team is dominating even when the scoreboard is level.
Lineups, injuries and suspensions matter too, which is why a forecast published before confirmed team sheets can change once starting elevens are announced.
How models turn data into a pre-match forecast
The typical workflow is a pipeline, not a single formula:
- Collect several seasons of match results and event data for each league.
- Engineer features from each team’s past performances: attack and defense strength, xG difference, rest days, home advantage.
- Fit a model. Research shows pre-match predictions can be produced by engineering features from teams’ past league performances and applying methods such as artificial neural networks or k-nearest neighbors.
- Output probabilities for the three outcomes, and often for derived markets such as both teams to score (BTTS) or total goals.
- Validate on matches the model has not seen, in chronological order.
The same research notes that the most successful approaches combine data-driven learning with soccer-specific domain knowledge to build predictive features, rather than depending on algorithmic complexity alone. In practice, a transparent model with well-chosen football features often matches a more elaborate one. For a deeper technical walk-through, BetsyScore’s football match prediction algorithm guide and its piece on building win probability models cover feature design and scoring in detail.
How live predictions change during a match
A pre-match forecast is fixed at kickoff. A live forecast is not. In-play models take in goal timestamps, shots, cards and the changing match state, and some use dynamic strength calibration or reinforcement learning to update outcome probabilities as the game progresses.
One in-game study describes a model that uses raw event and tracking data to predict win probabilities at every minute of the game. The behavior is intuitive once seen:
- A goal in the 15th minute moves probability sharply, but a goal in the 85th moves it far more, because less time remains for a response.
- A red card shifts the balance gradually, since the numerical advantage works over the remaining minutes.
- Sustained pressure without a goal raises the pressured side’s chances of scoring next, even when the win probability moves only a few points.
BetsyScore pairs live scores with a momentum read that shows which side is on top minute by minute. The mechanics are described in how live AI match data works, and current fixtures are on the live scores page.
How accuracy is measured
The most common mistake is judging a probabilistic model by whether its top pick won. A forecast of 55% for a home win is not wrong when the away side wins; it is wrong only if such forecasts, across many matches, do not win about 55% of the time.
Research literature uses several metrics, including the Brier score, log loss and Expected Calibration Error to assess whether predicted probabilities match observed frequencies.
| Metric | What it measures | How to read it |
|---|---|---|
| Brier score | Squared error between probabilities and the actual result | Lower is better |
| Log loss | Penalty for confident forecasts that turn out wrong | Lower is better; punishes overconfidence |
| Expected Calibration Error | Gap between stated probability and observed frequency | Closer to zero is better |
| Reliability diagram | Visual check of calibration across probability bands | Points near the diagonal indicate good calibration |
A worked example of the Brier score for a three-outcome match, summing squared errors across home, draw and away:
- Forecast 50% / 25% / 25%, home win occurs: 0.25 + 0.0625 + 0.0625 = 0.375.
- Forecast 80% / 10% / 10%, home win occurs: 0.04 + 0.01 + 0.01 = 0.06.
- Forecast 80% / 10% / 10%, away win occurs: 0.64 + 0.01 + 0.81 = 1.46.
The confident forecast earns a far better score when right and a far worse one when wrong. This is why one match proves nothing and why a track record over hundreds of fixtures is the real evidence.
Two further cautions from the research. First, accuracy becomes harder to achieve as the number of outcome classes increases, so a model predicting win versus not win cannot be compared directly with one predicting win, draw or loss. Second, a 2026 systematic review argues that headline performance is insufficient: evaluation should match the real decision time, prevent information leakage and test probability reliability. A tool that quotes a very high hit rate without saying when the prediction was made, or on which matches, has not met that standard.

The limits of AI soccer predictions
Football is a low-scoring sport, and a single deflection can decide a match. That structure caps how much any model can know in advance.
Most uncertainty is irreducible
A 2026 study that decomposed predictive uncertainty found that 99.4% was aleatoric, meaning it came from inherently variable outcomes such as tactical adjustments, referee decisions, injuries and random match events. Better parameter estimation can address only a very small remainder.
Around 50% accuracy can be normal
A peer-reviewed 2025 football study explains that accuracy near 50% can be normal for match-result models, because injuries, sendings-off, weather, refereeing errors and natural performance variation are difficult to quantify. Predictive analysis offers general probability insight, not certainty.
Many studies are not ready for real use
The 2026 systematic review of machine-learning studies in elite team sports found selective deployability: of 55 core analyses, 26 (47.3%) reached at least moderate deployability, and 56 of 78 assessed units carried a high risk of bias. Published accuracy claims deserve scrutiny for that reason.
Missing context biases forecasts
A 2025 World Cup prediction study cautioned that a model can show correlations with winning probability while still being affected by confounding or random effects, and that excluding weather, venue and other environmental factors can bias predictions. Tournament football adds travel, heat, altitude and short rest, all of which are harder to model than league fixtures.
How to read a prediction on BetsyScore
BetsyScore’s win-probability percentages are built from expected goals, recent form and head-to-head records, and they sit beside live lineups, player profiles and instant stats on the same match page. The practical way to use them:
- Read the three numbers together. A 40% / 30% / 30% split describes an open match, not a weak model.
- Check the lineups before treating a pre-match number as final.
- During play, compare the probability movement with the momentum read to see whether a lead is supported by pressure.
- Judge the model over many matches, not one result.
For a published, checkable record, the AI prediction record for World Cup 2026 shows how forecasts performed in that tournament. Fixture-by-fixture forecasts are on the AI predictions page.
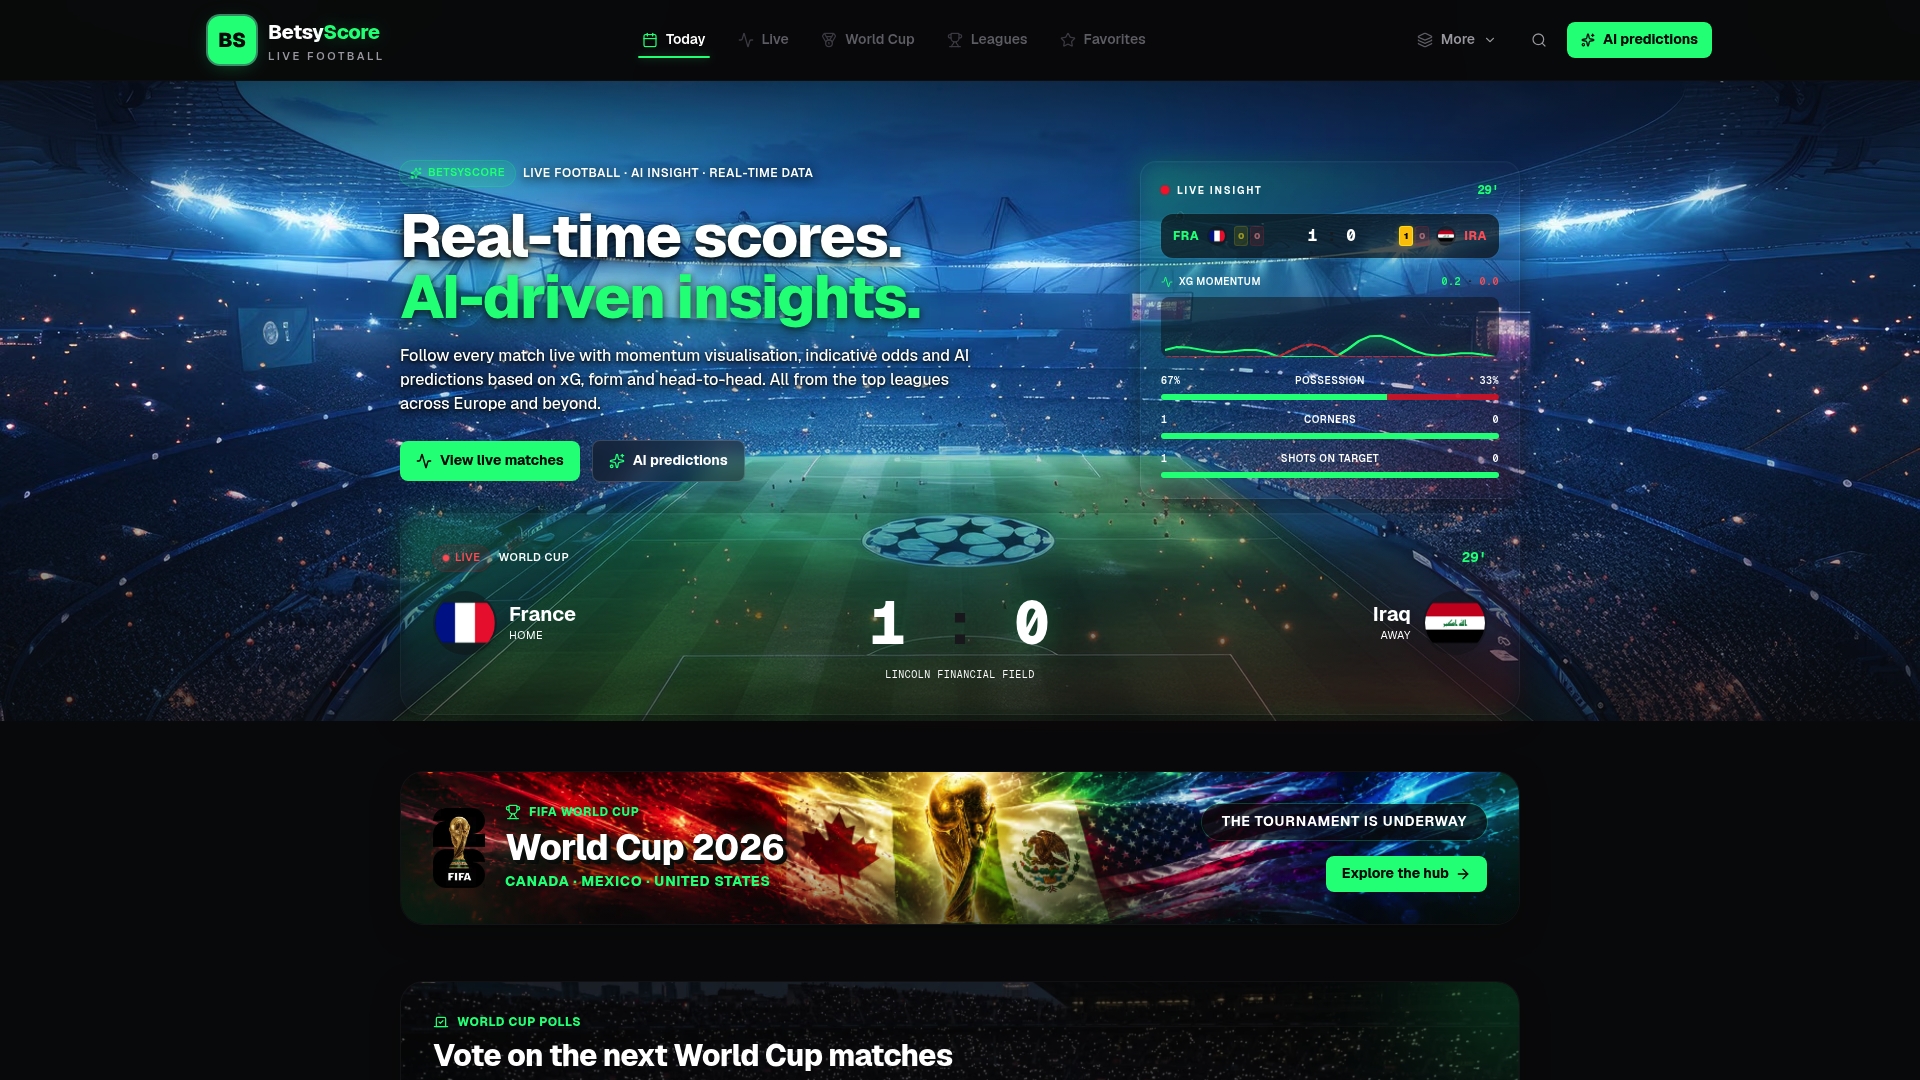
The full platform, covering live scores that refresh every few seconds and more than 200 competitions, is available from the BetsyScore home page.
Perspective: probabilities are a tool for thinking, not a promise
We build forecasts to describe a match, and we hold them to the same standard we recommend to readers. A percentage is useful when it is calibrated, explained and published with a record. It is not useful when it is treated as a guarantee.
The research reflects what we see in the data. When most of the uncertainty in a match is inherent to the sport, the honest job of a model is to quantify that uncertainty clearly. We would rather show a 45% favorite as a 45% favorite than present a confident pick the evidence does not support.
We also think the value of prediction is wider than the outcome. A win probability that climbs while a team trails tells a fan something about the match that the scoreboard hides. Momentum, expected goals and form are ways of seeing why a number moved. Our guides on reading AI football probabilities and on machine learning in football set out how we approach that work.
— Aria
A checklist for judging any AI soccer prediction tool
Use these questions before relying on a forecast from any source:
- Does it show all three outcomes? A tool that gives only a winner hides the draw.
- Does it publish a record? Look for results over a large number of matches, with the method of measurement stated.
- Does it report calibration or probability scores? Brier score or log loss is more informative than a hit rate alone.
- Is the timing clear? Predictions made after lineups and odds are known are easier than those made earlier.
- Does it name its inputs? Expected goals, form and head-to-head are standard; vague claims of proprietary intelligence are not evidence.
- Does it admit uncertainty? Claims of near-certain results contradict what the research says about football.
For readers who compare tools, BetsyScore also maintains a guide to the best football stats websites and live score apps. Readers interested in a competition-specific application can see how AI predicts Champions League matches, and those wanting a broader overview can read football results prediction for fans and bettors.
FAQ
Are AI soccer predictions accurate?
Accuracy depends on how it is measured. Peer-reviewed work suggests that around 50% accuracy on match results can be normal, because injuries, refereeing and random events are hard to quantify. Calibration, meaning whether stated probabilities match real frequencies over many matches, is a better test than a single hit rate.
What does a win probability percentage mean?
It is the model’s estimate of how often a result would occur in comparable situations. A 55% home win figure means the model expects the home side to win about 55 times in 100 such matches, and to fail to win about 45 times. The home win, draw and away win figures together total 100%.
Which data do AI soccer prediction models use?
Most combine expected goals, recent form, head-to-head records, home advantage and lineup information. Advanced models add event and tracking data to value individual player actions. Live models also use goals, shots and cards as the match unfolds.
Can AI predict a match while it is being played?
Yes. In-play models update win probabilities as the match state changes, and research describes models that produce a forecast at every minute. A late goal moves the figures much more than an early one because less time remains.
Can AI predictions replace my own judgment?
No. Forecasts summarize patterns in data, but they cannot fully account for factors such as late injuries, weather or tactical surprises. They work best as one input alongside lineups, context and your own knowledge of the teams.
Sources
- pi-football: A Bayesian network model for forecasting association football match outcomes
- Machine Learning for Soccer Match Result Prediction
- Mythbusting: Is Long Range Shooting a Bad Option?
- A data- and knowledge-driven framework for developing machine learning models to predict soccer match outcomes
- In-Game Soccer Outcome Prediction with Offline Reinforcement Learning
- The Application of Machine Learning Techniques for Predicting Match Results in Team Sport
- A Bayesian approach to predict performance in football (Frontiers, 2025)
- Deployability of machine-learning prediction in team sports (Frontiers, 2026)
- Bayesian outcome-specific ensemble modeling for football (Frontiers, 2026)
- Predicting football match outcomes (Frontiers, 2025)