AI Soccer Live: How Live AI Match Data Works

“AI soccer live” describes a live score feed with a modeling layer on top. The feed reports what has happened: goals, cards, lineups, shots. The AI layer estimates what is likely to happen next: a win probability that updates after each event, a momentum reading that shows which side is pressing, and a projected scoreline. This guide explains where that data comes from, how the numbers are produced, how reliable they are, and how to read them while a match is in progress.
TL;DR
- A live score records events. Live AI converts those events, plus form, expected goals and head-to-head history, into probabilities that change as the match changes.
- Momentum readings are built from how scoring chances develop over recent minutes, not from possession alone.
- Live probabilities can swing sharply after one event. A late equalizer can reverse a near-certain result, so a percentage is an estimate, not a verdict.
- Models are weaker on rare events such as red cards and penalties, and they are only as good as the speed and order of the incoming data.
- Check lineups, the stage of the match, expected goals and the size of any shift before trusting a single percentage.
Table of Contents
- What “AI soccer live” means and how it differs from a live score
- What live data AI can use to analyze a match
- How live win probability, momentum and predictions are produced
- How to interpret live probabilities as a match changes
- How accurate is live AI, and where does it fall short?
- A checklist for following a match live
- Our perspective
- Follow matches live with BetsyScore
- FAQ
- Sources
What “AI soccer live” means and how it differs from a live score
A traditional live score answers one question: what is the result right now. It lists the scoreline, the minute, the scorers and the cards. It is a record of the past ninety minutes, updated as quickly as the data supplier can publish it.
Live AI answers a second question: given everything that has happened so far, what is probably going to happen. That requires a model, and a model requires inputs. Three layers usually sit together on one page:
- The score layer. Goals, cards, substitutions, lineups and match time.
- The statistics layer. Shots, expected goals, possession, corners and other counts that describe how the match is being played.
- The prediction layer. Win probability, likely scoreline, both-teams-to-score probability and a momentum reading, all recalculated as the first two layers change.
The distinction matters because the layers can disagree. A team can lead 1-0 while the statistics layer shows the opponent creating far better chances. The score layer says one thing, the prediction layer another, and the gap between them is often the most useful information on the screen.
What live data AI can use to analyze a match
A model can only analyze what is recorded. The Common Data Format paper, published in December 2024, describes six broad categories of football match data: match sheet, video, event, tracking, match metadata and player physical data. Each serves a different purpose.
| Data category | What it contains | What a live model does with it |
|---|---|---|
| Match sheet | Lineups, formations, referees, substitutions | Adjusts team strength for who is actually on the pitch |
| Event data | Passes, shots, tackles, fouls, with time and location | Calculates expected goals and the flow of play |
| Tracking data | Positions of players and the ball many times per second | Measures pressing, spacing and attacking structure |
| Video | Broadcast or tactical camera footage | Supplies computer-vision inputs where tracking is unavailable |
| Match metadata | Competition, venue, date, conditions | Provides context such as home advantage |
| Player physical data | Distance, speed, workload | Flags fatigue and intensity |
The same paper notes that the Common Data Format aims to standardize football data specifications so that analysis is consistent across providers. That is a real problem in practice: different suppliers define events differently, and a model trained on one definition can misread another.
The field has also professionalized. Research on football prediction models published in 2025 reports that more than 85% of Premier League clubs have specialized data analysis departments, which explains why the underlying data has become so detailed.
Coverage is not equal everywhere
Not every match is recorded with the same depth. Top competitions often have event data and, in some cases, tracking data. Lower divisions may only have goals, cards and lineups. For top European competitions, the governing body has signed data agreements: UEFA and its data partner extended their partnership to cover UEFA competitions, including betting data, media distribution and access to certain advanced tracking data used for AI products. A Champions League match can therefore support richer live analysis than a regional cup tie, and a model’s output should be read with that in mind.
How live win probability, momentum and predictions are produced
Win probability
A pre-match model starts from team strength, recent form, expected goals and head-to-head records. Once the whistle blows, a live model adds the game state: the score, the minute, cards and substitutions. After each event it recomputes the chance of a home win, a draw and an away win. For a deeper look at the mechanics, see our guide to building football win probability models.

The purpose of the live figure is to show how in-game events alter winning chances. AWS and the Bundesliga illustrate it with a match in which Bayern’s win probability fell from 90% to 8% after Stuttgart equalized in stoppage time. The model did not fail in that example. It registered that a near-certain win had become a draw.
Expected goals
Expected goals, or xG, assigns every shot a value between 0 and 1 based on how often similar shots have been scored. A shot worth 0.10 xG is expected to score about one time in ten. Summed over a match, xG describes the quality of chances created rather than the number of shots taken. It is one of the main inputs for live prediction because it is less random than the scoreline.
Momentum
Momentum is less standardized than xG, so providers define it differently. One documented approach comes from computer-vision research described by AWS: a near-real-time intensity index built from predicted goal probabilities, and a momentum index based on how those probabilities change over recent seconds. The reported prototype achieved 75% precision and 90% recall for identifying attacks that led to goals. The point to take away is the design: momentum measures the direction and speed of change in scoring threat, not who has the ball.
Prediction cadence
Because the model is rerun after events, a live system can produce a very large number of forecasts per match. The consequence for readers is that the number on screen is always a snapshot. Our overview of machine learning in football covers how these updates are generated, and the football match prediction algorithm guide explains the pre-match foundations.
How to interpret live probabilities as a match changes
A percentage is easy to misread. These rules prevent most errors.
- Read it as a likelihood, not a promise. Stats Perform’s data-science view, reported by FourFourTwo, is that win probability indicates what is likely given the evidence so far, and that football remains unpredictable. A 70% favorite loses three times in ten.
- Look at the size and cause of each shift. A jump after a goal is expected. A jump with no goal, after a red card or a tactical change, tells you the model considers that event decisive.
- Account for the minute. The same one-goal lead is worth far more at minute 85 than at minute 25. Probabilities become steadier late in the match because fewer events remain.
- Separate the score from the process. If a leading team has a much lower xG, the probability usually reflects the lead and the minute, and may fall quickly if the opponent scores once.
- Remember the draw. Soccer is low scoring, so the draw is a real outcome. A match showing 45% / 30% / 25% is not a two-way contest.
For a full walkthrough of reading probability outputs, see our guide to AI football predictions.
How accurate is live AI, and where does it fall short?
Accuracy is measurable, and the research is candid about the limits.
Low scoring is the central difficulty. A 2021 paper on in-game win probability says such models can enhance the fan experience and help evaluate coaching decisions, while adoption in soccer has been held back by technical challenges from the sport’s low-scoring nature. That is why specialized Bayesian frameworks were developed to handle in-play uncertainty.
Calibration can be measured. A model is well calibrated when events it rates at 30% happen about 30% of the time. A 2025 study evaluated models with Expected Calibration Error and ranked probability score, and found that a Bayesian in-play model reached an Expected Calibration Error of 0.002 in the final 10% of matches, against values above 0.1 for the other models tested. Late-match calibration can be excellent, but that result belongs to one study and one dataset, and it does not transfer automatically to every product.
Data quality sets the ceiling. A professional analysis of live systems notes that quality depends on event ordering, latency, state reconciliation and replay testing, because a final match record cannot show what the system knew at each live moment. If a goal arrives late or events arrive out of order, the output is wrong for a few seconds regardless of how good the model is.
Rare events are hard. Red cards and penalties are infrequent, so models have little history to learn from. Treat sudden shifts after such events with extra caution, and expect them to be revised as more information arrives.
A checklist for following a match live
Before relying on any live reading, check these items in order.
- Lineups. Confirm the starters and any late absence. A missing goalkeeper or main striker changes team strength.
- Match state. Note the score, minute and cards. These drive most of the live probability.
- Expected goals. Compare xG with the score. A large gap suggests the scoreline may not last.
- Momentum direction. Check whether pressure is rising or fading, not only who has more of the ball.
- Head-to-head and form. These explain the pre-match starting point from which the live figure moved.
- Competition coverage. Remember that depth of data varies, as described above.
Our guide to analyzing a football match in real time expands on each step, and our explanation of football data sources describes where matchday numbers originate.
Our perspective
We build BetsyScore around a simple principle: a live score is the minimum, and the context around it is what makes it useful. Our scores refresh every few seconds, and the prediction layer combines expected goals, recent form and head-to-head records into win-probability percentages, with a momentum read that shows which side is on top minute by minute.
We also hold that a probability should be accountable. A figure that cannot be checked afterward is decoration. That is why we publish an AI prediction record for the World Cup 2026, so readers can compare stated probabilities with what happened. The most common mistake we see is treating a percentage as a forecast of certainty. The most useful habit is the opposite: ask what the number would be if the next event went the other way.
Live AI does not replace watching the match. It gives the viewer a second instrument, one that is sharpest when the score and the underlying chances disagree.
— Aria
Follow matches live with BetsyScore
BetsyScore combines live scores with AI predictions across the FIFA World Cup 2026, the Premier League, La Liga, Bundesliga, Serie A, the Champions League and more than 200 competitions worldwide. Each match page includes live lineups, instant stats, win-probability percentages and the momentum read.
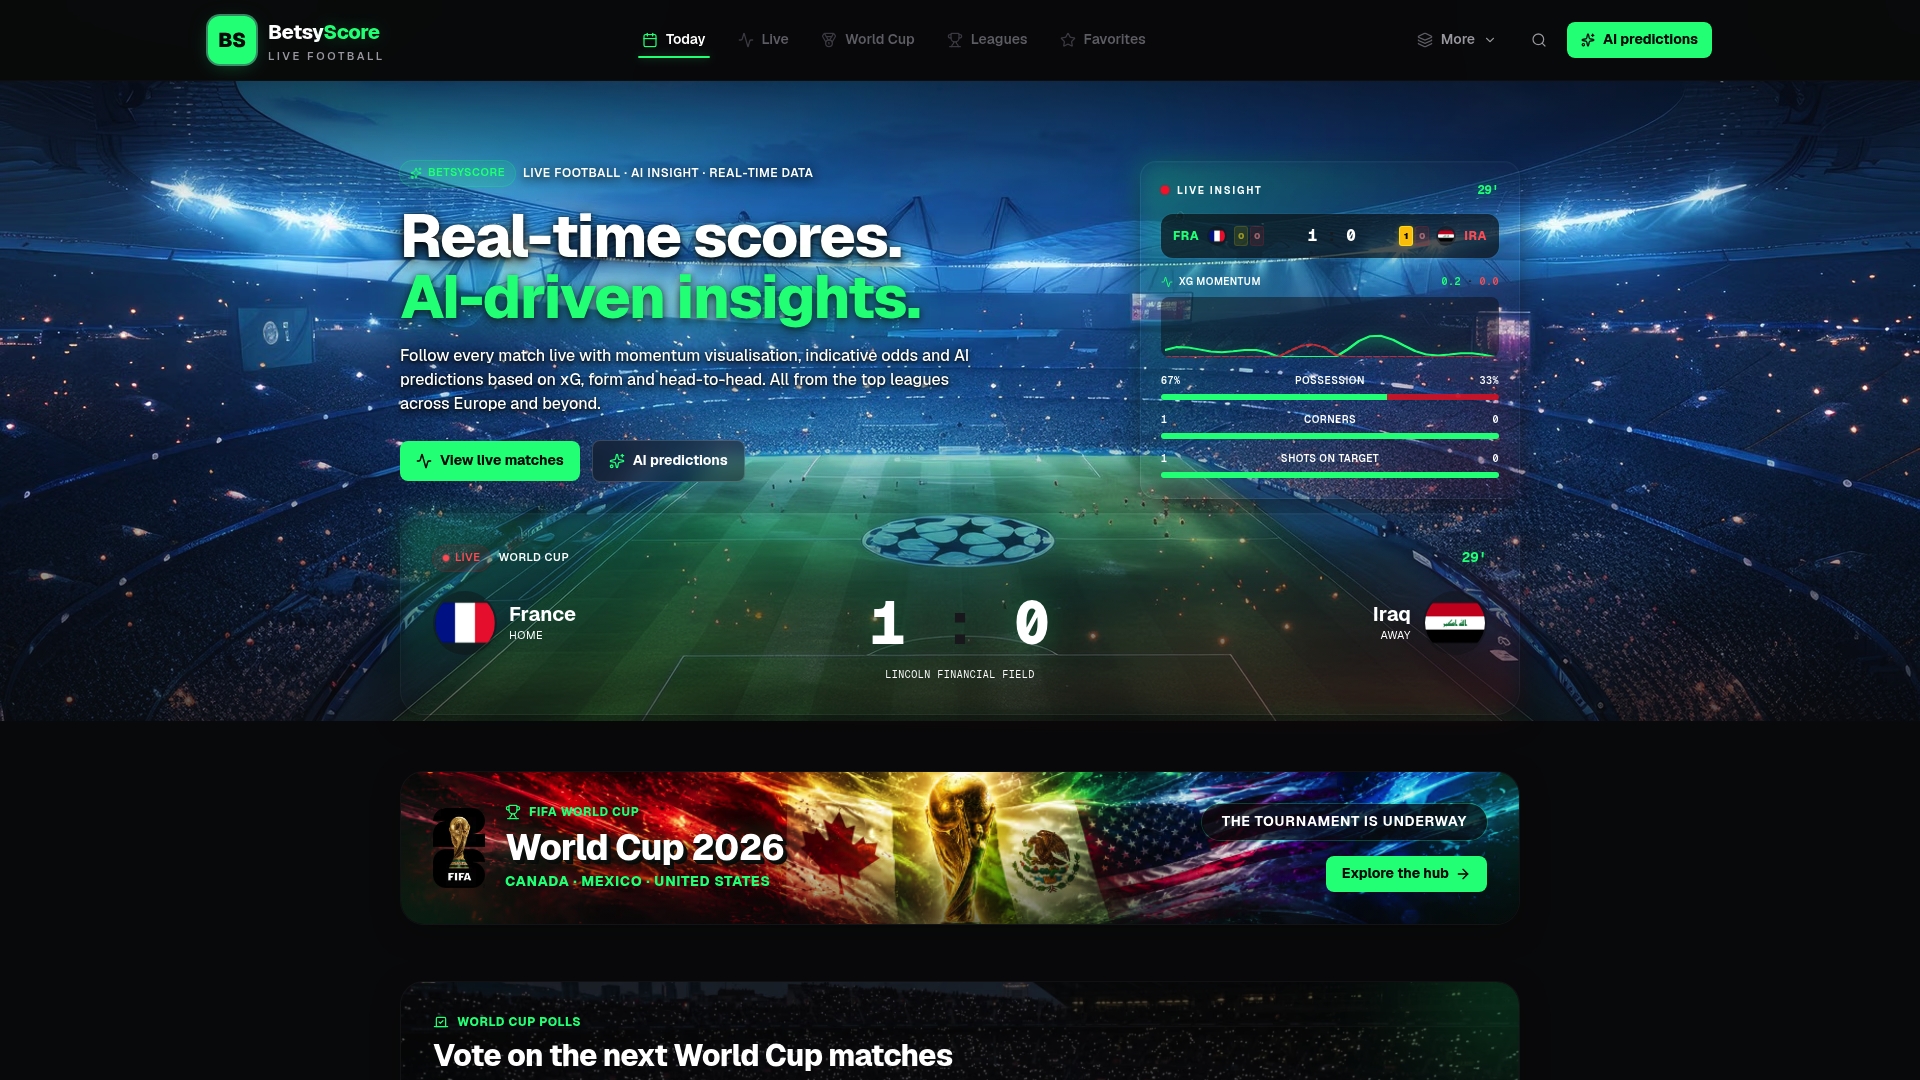
Open the live matches page to follow games in progress, or browse today’s AI match predictions before kickoff. For specific markets, the BTTS predictions page shows both-teams-to-score probabilities, and the predicted scorelines for today list a projected result for each match.
FAQ
Is there a soccer AI?
Yes. Several kinds exist: models that estimate win probability before and during matches, computer-vision systems that read broadcast or tracking footage, and club analytics tools. Public platforms usually offer the first kind, showing probabilities, expected goals and momentum beside the live score.
What is the difference between AI soccer live and a live score?
A live score reports events that have already happened. AI soccer live adds estimates about what is likely next, such as win probability and momentum, and recalculates them as the match changes. The two are best read together.
How accurate are live AI soccer predictions?
Accuracy depends on the model, the data and the stage of the match. Research shows well-calibrated in-play models can be very reliable late in a match, but soccer’s low scoring and rare events such as red cards and penalties limit precision. A probability describes likelihood, and unlikely results still occur.
Which competitions have the most detailed live data?
Top competitions generally have the deepest coverage, including event data and, in some cases, advanced tracking data. Lower divisions often have only scores, cards and lineups. Predictions for those matches rest on less information and deserve more caution.
Sources
- Common Data Format (CDF): a standardized format for football data
- Research on football prediction models and probability statistics, 2025
- Dealing with Probability Statistics Prediction on Sporting Events
- UEFA and Sportradar extend and expand partnership
- Bundesliga Match Fact Win Probability
- Predicting soccer goals in near real time using computer vision
- Explained: What is win probability and how does it work?
- A Bayesian Approach to In-Game Win Probability in Soccer
- Live AI Football Predictions Explained