Substitutions Impact Analysis in Soccer: Metrics and Evidence

Substitution impact analysis measures how a team performs before and after a change, then separates the effect of the substitute from everything else happening in the match. A goal or an assist is a single event. Impact analysis asks a broader question: did the team create better chances, defend more securely, run harder or control more space once the player came on, and would that have happened anyway given the score and the minute?
This guide explains the metrics analysts use, how an expected goals difference window works, how timing and match state change the reading, and what peer-reviewed research has found across the Premier League, La Liga, the Bundesliga, the Eredivisie and UEFA EURO 2024.
TL;DR
- Substitution impact is best measured as a change in team performance, most often expected goals difference (xGD), across a fixed window before and after the change, not as the substitute’s own goals and assists.
- Timing matters: in the UEFA EURO 2024 study, substitutions made between 60 and 85 minutes had the highest effectiveness rate and those between 45 and 60 minutes the lowest.
- Match state, opponent quality, player role and tactical intent all shift the expected result, so a raw before-and-after comparison overstates or understates the real effect.
- Causal methods such as Targeted Maximum Likelihood Estimation (TMLE) exist to separate a substitution’s effect from coincidence, but they rest on assumptions that cannot be fully verified.
Table of Contents
- What substitution impact analysis measures
- Metrics analysts use
- How an xG difference window works
- Timing, match state and role
- What the research found
- Separating cause from coincidence
- A step-by-step method for your own analysis
- Limits worth keeping in mind
- Follow substitutions as they happen
- FAQ
- Sources
What substitution impact analysis measures
The traditional view of a substitute is built on output: goals, assists, perhaps key passes. That view rewards the player who happens to be in the right place and ignores everything else a change can do. A holding midfielder who stabilizes a lead produces no goals, yet the change may be the reason the lead survives. A winger who runs at tired full-backs may lift a team’s chance quality for twenty minutes without scoring.
Impact analysis therefore works at two levels:
- Individual impact: what the substitute does in the minutes played, such as high-intensity running, passing and organizing output, shots and defensive actions, compared with the player replaced and with players who finished the match.
- Team impact: how the team’s performance indicators move after the change: chance quality, possession, territorial control, defensive stability and shape.
The second level is the more informative one, and it is also the harder one, because a team’s performance changes constantly for reasons unrelated to the bench.
Metrics analysts use
No single statistic captures a substitute’s value. Analysts normally combine several, each emphasizing a different aspect of the match.
| Metric | What it captures | Main caution |
|---|---|---|
| xG difference (xGD) before vs. after | Change in chance quality created minus chance quality conceded | Model-dependent, sensitive to score and minute |
| Goal difference in windows | Direct scoring outcome | Small samples, high variance |
| Possession and territorial control | Whether the team holds more of the ball and pitch | Possession alone does not equal threat |
| Shots and shots conceded | Attacking and defensive volume | Ignores shot quality |
| Physical output (distance, high-intensity running, sprints) | Energy brought to the pitch | Does not show whether effort was useful |
| Passing network indicators | Cohesion, clustering, width and compactness | Needs tracking or detailed event data |
| Win probability change | Whether the player moves the chance of winning | Requires a trained model |
The same logic applies to the underlying chance model. Readers who want the foundation can start with our explainer on turning xG and xGA into live signals, and with the comparison of possession against xG for why possession alone is a weak proxy for impact.
How an xG difference window works
The most widely used team-level approach compares a team’s expected goals difference in a window before the change with a window after it. The KU Leuven DTAI group applied this to top European leagues, using data covering seasons in which five substitutions per match were allowed, including La Liga, Serie A, Ligue 1 and the Bundesliga. Their analysis classifies a substitution as positive if xGD increased by 0.5 or more after the change, negative if it decreased by at least 0.5, and neutral otherwise.
That three-way classification is useful because most substitutions do very little. A kNN model trained on earlier seasons reached 74% accuracy on the ongoing 2022/23 season, compared with 55% for always predicting the most common (neutral) class. The same study reported a higher rate of expected value by substitutes and a notable increase in xG after the first and second substitution windows, which the authors attribute to fresh legs and tactical adjustments.

Choosing the window
The length of the window changes the answer. A common practice is to split the match into three periods: before the change, the first ten minutes after it, and the remainder of the match. The short window shows the immediate effect of a tactical reshuffle, while the longer one shows whether it lasted. The La Liga passing-network study described below used a within-team design comparing the 15 minutes before and after each substitution batch.
A practical rule: report at least two window lengths. If the effect appears in the first ten minutes and disappears afterward, the change produced a short burst, not a lasting improvement.
Why xG rather than goals
Goals in a 15-minute window are rare and noisy. The Wharton Sports Analytics and Business Initiative used xG scored in a time frame instead of actual goals, noting that xG is an unbiased estimate of goals scored with smaller variance. Its analysis also quantified context that any impact estimate must respect: home field advantage is worth 0.23 goals per 90 minutes, and scoring rates rise by about 0.175 goals per 90 minutes in the second half and extra time.
That second figure matters directly. Scoring rates rise late in matches whether or not anyone is substituted, so a simple comparison of the first half against the last twenty minutes would credit the bench with a trend that already existed.
Timing, match state and role
Timing
The UEFA EURO 2024 study published in Frontiers in Sports and Active Living analysed 51 matches and 466 substitutions. Its decision-tree analysis found the highest substitution effectiveness rate between 60 and 85 minutes and the lowest between 45 and 60 minutes. The authors caution that decision trees may oversimplify dynamic game scenarios and cannot fully account for the non-linear nature of match outcomes. The study also found that 72% of substitution decisions came from changing the team’s setup or players’ positions, and that the most common negative (69%) and positive (61%) impact followed substitutions made after the 20th minute.
A 2016 analysis of elite matches by Gómez, Lago-Peñas and Owen examined 292 substitutions from 50 games. Most first and second substitutions fell between minutes 61 and 90, the third mostly between 76 and 90, teams substituted earlier when losing than when drawing or winning, and home teams substituted earlier than away teams. The same study found midfielders accounted for 57.1% of substitutions and forwards 27.1%.
Match state
Match status shapes both the decision and the expected outcome. In the EURO 2024 data, coaches generally introduced defenders when ahead and offensive players when losing. This is the central confound in impact analysis. A team chasing a goal is likely to attack more after a change regardless of who comes on, and a team protecting a lead is likely to concede territory. Comparing a trailing team’s post-substitution xG with its pre-substitution xG without accounting for score state mixes the tactical posture with the player’s contribution.
Role and tactical intent
The Bundesliga study by Lorenzo-Martínez and colleagues classified 659 substitutions from 234 matches in 2016-2017 as neutral (485), defensive (45) or offensive (129). Teams displayed a significantly lower stretch index after defensive substitutions, and the team centroid position and space control in the middle and attacking thirds were greater after offensive substitutions. The authors concluded that coaches should make more offensive substitutions to elicit higher defensive pressure and improve goal-scoring opportunities.
The lesson for analysts is to label intent before scoring impact. A defensive change that lowers the stretch index and preserves a 1-0 lead has worked, even though xG may fall.
What the research found
| Study | Sample | Main finding |
|---|---|---|
| Premier League, 2014 | 810 full-match players, 286 substitutes and the 286 players replaced | Most substitutions occurred at halftime and between the 60th and 85th minutes; high-intensity running was greater in substitutes (effect size 0.28 to 0.67) |
| Chinese Super League, 2018 season | 5,871 observations, 395 players | Substitutes showed higher high-intensity and sprint distance relative to playing time; offensive substitutes showed higher passing and organizing output, and central midfielders higher scoring output |
| Bundesliga, 2016-2017 | 659 substitutions, 234 matches | Offensive substitutions were followed by greater space control in the middle and attacking thirds |
| LaLiga SmartBank, congested periods | 66 matches, before and after the pandemic | With more substitutions allowed, total distance rose in some variables, and substituted-in players’ physical output exceeded that of those who played the full match |
| La Liga, 2023-2024 | 380 matches, 2,077 substitution batches | Late substitutions were followed by lower pass completion and network clustering; strategic ones left indicators unchanged or slightly improved |
| UEFA EURO 2024 | 51 matches, 466 substitutions | Effectiveness highest at 60 to 85 minutes; positive impact associated with winning matches was 52% to 65% |
Reading the La Liga passing-network study
The 2023-2024 La Liga study, published in BMC Sports Science, Medicine and Rehabilitation, grouped substitutions into strategic (45 to 60 minutes, 445 batches), regular (61 to 75 minutes, 829) and late (after 75 minutes, 803). Following late substitutions, pass completion fell 5.9% (standardized d = 0.47 versus strategic), passing-network clustering declined 18.4% (d = 0.41), and convex hull area contracted 4.7% and team width 3.2% (d = 0.45). Strategic substitutions left these indicators unchanged or slightly improved.

This does not mean late substitutions are poor decisions. Late changes are often made to protect a result or run down the clock, and a more compact, less connected shape may be exactly the intent. It shows why cohesion metrics must be read with the match state. For a deeper treatment of network metrics, see our guide to xT-weighted pass networks and the explainer on expected threat.
Separating cause from coincidence
A team that improves after a substitution may have improved anyway: an opponent tires, a red card changes the match, or the trailing side simply pushes forward. Our analysis of red card impact shows how large such an event can be on its own, and any impact estimate that ignores it is contaminated.
Dijkhuis and Blaauw applied Targeted Maximum Likelihood Estimation to 302 Eredivisie matches from 2018-2019, using optical tracking data divided into five-minute periods (5,226 observations) to estimate the causal effect of a substitution on total team distance. The method frames the question as a counterfactual: what would the team have done had the substitution (A=1) not been made (A=0)? It requires two assumptions:
- Positivity: enough observations with and without treatment in every stratum of the confounders.
- No unmeasured confounding: no hidden factor linking the decision to the outcome. The authors note this is hard to validate, since unknown confounders such as an injury or a tactical decision always exist.
For most analysts, a full causal model is more than the job needs. A workable middle path is to compare each substitution with matched situations in which no change was made: same score, same minute band, similar opponent strength. If the post-change xGD still differs from the matched baseline, the case for an effect is stronger.
A step-by-step method for your own analysis
- Define the event. Record the minute, the score, the players on and off, their positions and the intended purpose (offensive, defensive or neutral).
- Pick windows. Use a short window of about ten minutes and a longer one of about fifteen to twenty, plus the remainder of the match.
- Choose the outcome. xGD is the usual default; add possession, shots conceded and a physical or shape metric for context.
- Classify the result. Use a threshold such as plus or minus 0.5 xGD, or report the continuous change with an interval.
- Adjust for context. Control for score state, minute, home advantage and opponent strength, or compare with matched no-substitution situations.
- Aggregate carefully. One substitution is anecdote. Hundreds across a season, grouped by timing and intent, start to say something.
- State the model. xG models differ, and impact figures inherit their assumptions.
Expected points can add a result-oriented layer to the same exercise, as covered in our guide to expected points (xP).
Limits worth keeping in mind
Even good studies are bounded. Samples come from specific leagues and seasons, from the Premier League in 2014 to the Chinese Super League in 2018 and La Liga in 2023-2024. Rules changed when five substitutions were permitted, so older results may not transfer unchanged. Decision trees simplify non-linear matches, and physical output is not the same as useful output. The sensible conclusion is that substitution impact is real and measurable on average, but any single change should be read in context.
Our perspective
At BetsyScore we treat a substitution as a change in the state of the match, not as a line in a player’s stat sheet. Our predictions are built from expected goals, recent form and head-to-head records, and our momentum read shows which side is on top minute by minute. Together they give a natural frame for impact analysis: the pre-change picture is visible, the post-change shift appears within minutes, and the lineup data shows who came on and for whom.
We believe the most useful question is whether the team’s trajectory moved, and the live win-probability and momentum views are designed to make that movement visible as it happens. For analysts, bloggers and journalists, that means a substitution can be discussed with evidence from the first minutes after the change instead of a hunch after the final whistle.
Aria
Follow substitutions as they happen
BetsyScore refreshes live scores every few seconds and pairs them with live lineups, instant stats and a minute-by-minute momentum read across more than 200 competitions, including the Premier League, La Liga, the Bundesliga, Serie A and the Champions League. That makes it a practical place to note when a change is made and watch how the match responds.
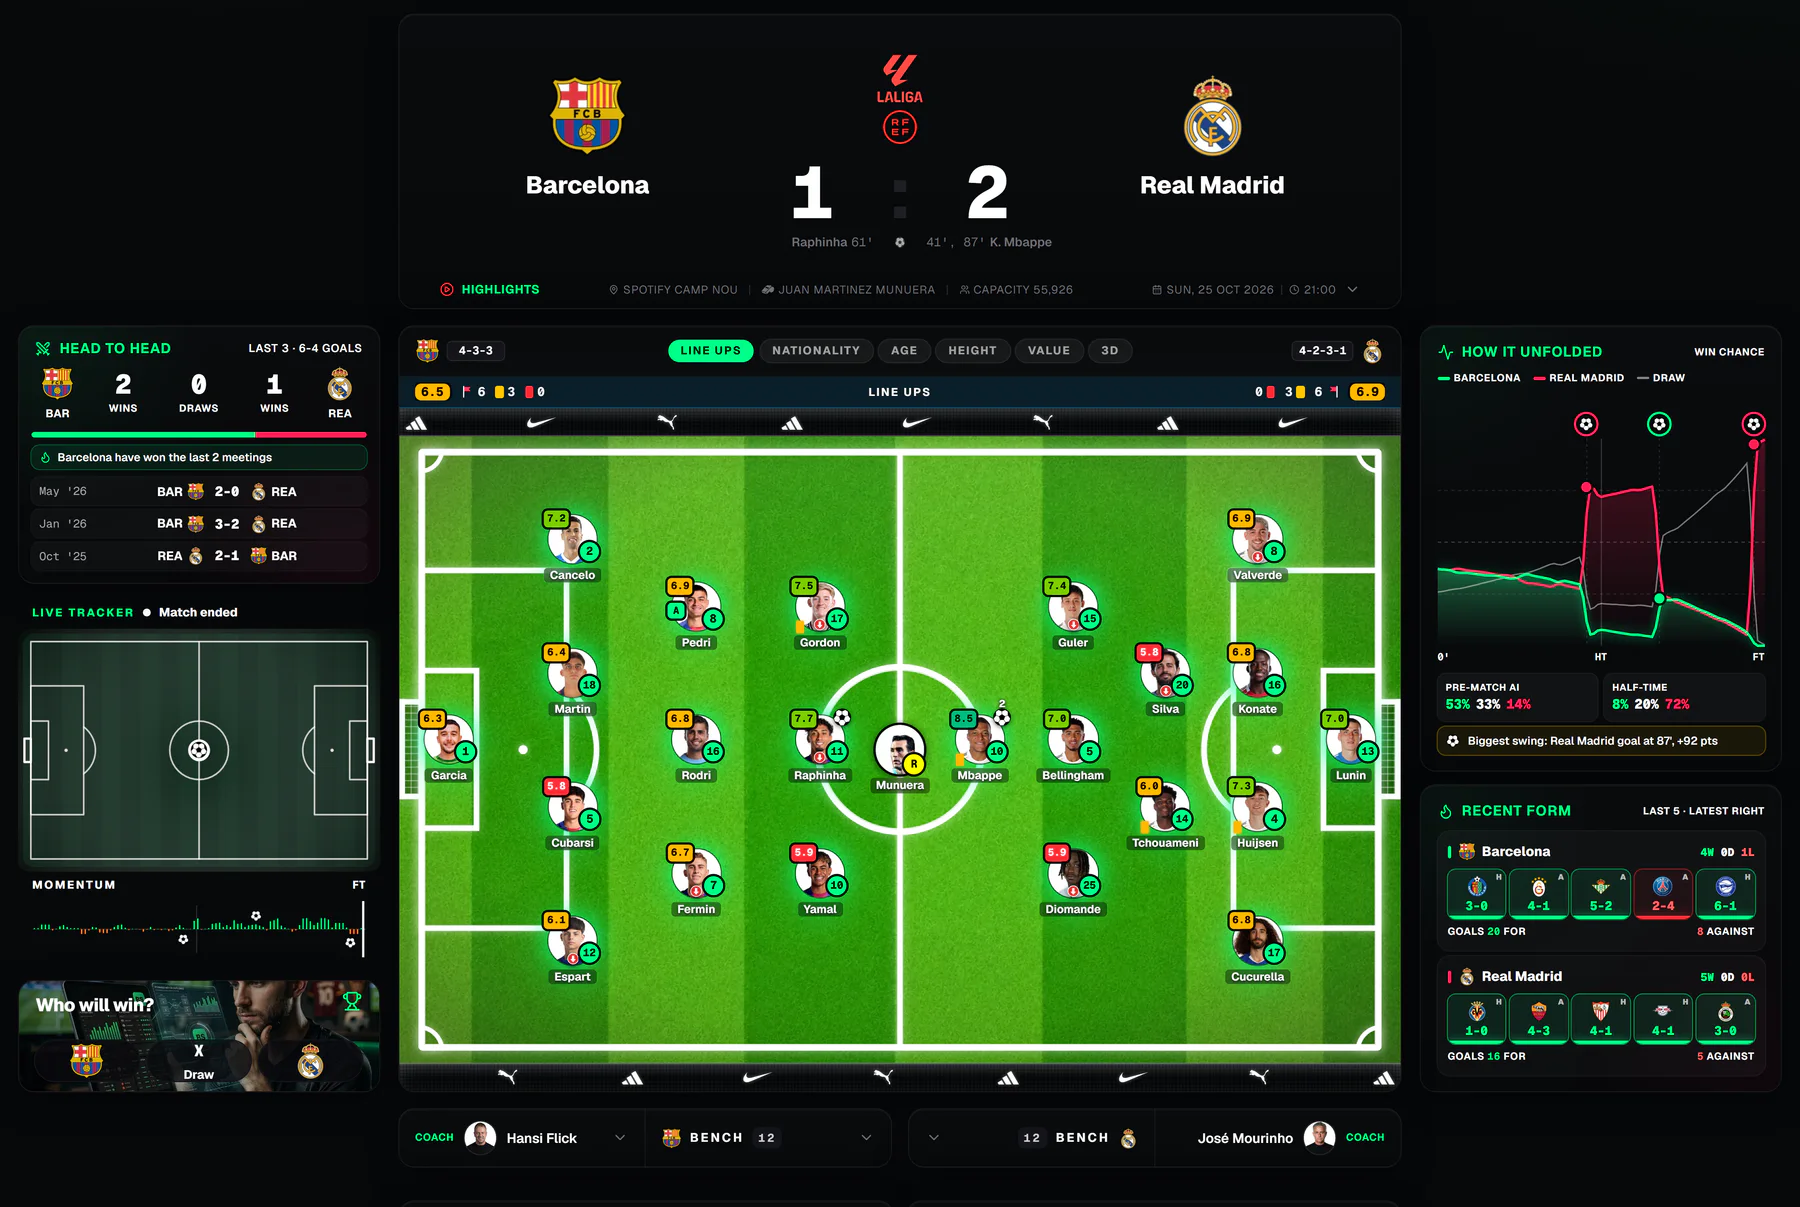
Open the live matches page to follow current games, or see the AI predictions for win probabilities built from expected goals, form and head-to-head records. For how such models are put together, read our practitioner’s guide to match prediction algorithms.
FAQ
How is substitution impact different from counting a substitute’s goals and assists?
Goals and assists record only the finished event. Impact analysis measures the change in team performance after the substitution, such as xG difference, defensive stability, possession or passing structure. A substitute who makes no goal contribution can still have a clearly positive impact.
What is a good threshold for a positive substitution?
There is no universal standard. One published approach from KU Leuven labels a change positive when xGD rises by 0.5 or more, and negative when it falls by at least 0.5. Analysts should state their threshold and window length so results can be compared.
When are substitutions most effective?
In the UEFA EURO 2024 study, effectiveness was highest between 60 and 85 minutes and lowest between 45 and 60 minutes. That is an average across 466 substitutions, and match state and tactical intent can change the picture for an individual game.
Can analysts prove a substitution caused an improvement?
Not with certainty. Causal methods such as TMLE define a counterfactual and require assumptions, including no unmeasured confounding, which the authors themselves describe as hard to validate. Matched comparisons and larger samples make the case stronger.
Sources
- Unraveling the Strategy of Soccer Substitutions Using Data, KU Leuven DTAI
- Optimal Substitution Time, Wharton Sports Analytics and Business Initiative
- The influence of substitution decisions made by coaches at UEFA EURO 2024, Frontiers in Sports and Active Living
- The influence of substitutions on elite soccer teams’ performance, Gómez, Lago-Peñas and Owen (2016)
- The Effect of Substitutions on Team Tactical Behavior in the Bundesliga, Research Quarterly for Exercise and Sport
- Evaluation of the Match Performances of Substitution Players in the English Premier League, International Journal of Sports Physiology and Performance
- Exploring the impact of professional soccer substitute players, BMC Sports Science, Medicine and Rehabilitation
- Effect of Increasing the Number of Substitutions on physical performance in LaLiga SmartBank, Sports (MDPI)
- Substitution timing and within-match changes in team passing networks, BMC Sports Science, Medicine and Rehabilitation
- Transferring Targeted Maximum Likelihood Estimation for causal inference in soccer, Entropy (MDPI)