Possession-Adjusted Stats for Soccer Analysts Explained
Possession-adjusted stats, commonly abbreviated as PAdj, normalize raw defensive counts to a neutral 50/50 possession baseline so that defensive opportunity is comparable across teams with different playing styles. The core linear formula is: PAdj = raw count × (0.5 ÷ (1 − possession share)). Logistic and sigmoid variants also exist, most notably the formula published by StatsBomb: PAdj = x × 2 ÷ (1 + exp(−10 × (possession − 0.5))). Analysts at providers including StatsBomb, Wyscout, and Opta use these methods to make defensive metrics like tackles, interceptions, and clearances comparable across systems.
PAdj is the right tool when you need to compare defensive workload across players or teams operating under structurally different possession environments.
Table of Contents
- Why does possession bias make raw defensive stats misleading?
- How do you calculate possession-adjusted stats?
- How do you implement possession-adjusted stats in practice?
- Key Takeaways
- Why PAdj is a lens, not a verdict
- Authoritative sources and further reading
- FAQ
Why does possession bias make raw defensive stats misleading?
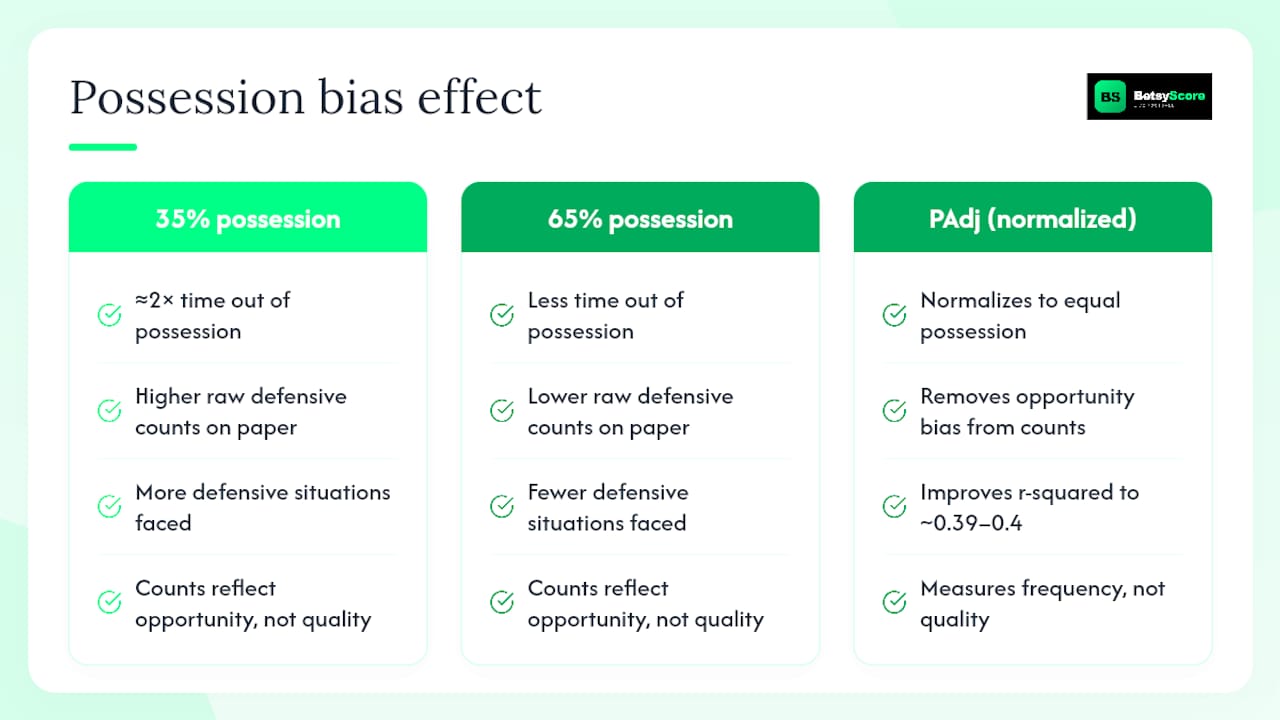
A defender on a team that holds 35% possession spends roughly twice as much time out of possession as a defender on a team that holds 65%. Raw interception counts reflect that difference in opportunity, not necessarily in quality or effort.
The practical problem: a scout comparing two center-backs across different leagues or systems is essentially comparing players who faced different volumes of defensive situations. Without adjustment, the low-possession defender almost always looks more active on paper.
StatsBomb’s research showed that adjusting team-level defensive rates for possession improved the r-squared correlation to shots conceded and goals allowed, with adjusted figures reaching approximately 0.39–0.4. That improvement signals that PAdj is capturing something real about defensive exposure, not just inflating numbers.
PAdj answers a specific counterfactual: what would this player’s defensive output look like if both teams had equal possession? It does not measure quality of actions, only normalized frequency.
How do you calculate possession-adjusted stats?
Two main formulas are in common use. The simple linear approach scales raw counts directly to the 50% baseline. The logistic approach, preferred by advanced practitioners, applies a sigmoid curve that limits extreme inflation.
Linear scaling
The SoccerAnalytics formula is:
For a player on a team with 35% possession: PAdj = raw × (0.5 ÷ 0.65) = raw × 0.769. That multiplier is less than 1, so the raw count is scaled up toward the neutral baseline. For a team at 65% possession: PAdj = raw × (0.5 ÷ 0.35) = raw × 1.429, scaling up.
The weakness: at extreme possession values (below 25% or above 75%), the multiplier becomes very large or very small, producing inflated or suppressed figures that may not reflect reality.
Logistic/sigmoid scaling
StatsBomb’s formula, documented in Hudl’s support glossary, is:
The sigmoid curve compresses extreme values smoothly. At 50% possession the multiplier equals exactly 1.0, so no adjustment is applied. At 35% possession the multiplier is approximately 0.73; at 65% it is approximately 1.46. The curve flattens at the extremes, preventing the runaway inflation that linear scaling can produce for outlier teams.
How possession itself is measured
Possession percentage is not a single universal figure. Many providers, including those using Opta-style event data, compute it as:
Other approaches use time-in-play segmentation or video-based pass-detection algorithms. The method matters because it changes the denominator used in every PAdj calculation. Always document which possession definition you are using when sharing adjusted figures.
| Method | Formula | Strengths | Limitations |
|---|---|---|---|
| Linear scaling | raw × (0.5 ÷ (1 − poss)) | Simple, transparent | Inflates at extreme possession |
| Logistic/sigmoid | x × 2 ÷ (1 + exp(−10 × (poss − 0.5))) | Handles outliers, smooth curve | Less intuitive; requires sigmoid parameters |
| Pass-count possession | team passes ÷ total passes | Widely available, consistent | Does not capture time; biased by style |
| Time-in-play possession | seconds in possession ÷ total time | Reflects actual exposure | Requires tracking or video data |
How do you implement possession-adjusted stats in practice?
Required inputs
- Raw defensive event counts per player per match (tackles, interceptions, clearances)
- Team possession share per match (pass-count or time-in-play, documented)
- Minutes played per match
- Event timestamps if computing match-by-match rather than season-aggregate
Python-style pseudocode
import numpy as np

def padj_linear(raw, poss_share):
    # Avoid division by zero; clip possession to [0.01, 0.99]
    poss_share = np.clip(poss_share, 0.01, 0.99)
    return raw * (0.5 / (1 - poss_share))

def padj_sigmoid(raw, poss_share):
    poss_share = np.clip(poss_share, 0.01, 0.99)
    multiplier = 2 / (1 + np.exp(-10 * (poss_share - 0.5)))
    return raw * multiplier

# Per-match application, then aggregate to per-90
player_df['padj_linear'] = padj_linear(player_df['raw_interceptions'],
                                        player_df['team_poss_share'])
player_df['padj_sigmoid'] = padj_sigmoid(player_df['raw_interceptions'],
                                          player_df['team_poss_share'])
Apply the adjustment per match, then sum adjusted counts and divide by total minutes to get per-90 figures. This per-match approach is more accurate than applying a season-average possession share to a season total.
Smoothing and small-sample corrections
- Set a minimum-opportunity filter: exclude players below 900 minutes before reporting season-level PAdj.
- For very small samples, apply shrinkage toward the league mean (a simple Bayesian prior) rather than reporting a raw PAdj that may be driven by two or three matches.
- Clip the sigmoid parameters if you are working with a league where possession extremes are common; tightening the curve (e.g., using −8 instead of −10 in the exponent) reduces sensitivity.
Quality check: After computing PAdj, compare the rank order of players before and after adjustment. If the top 10 barely changes, your possession distribution is narrow and adjustment adds little. If the rank order shifts substantially, document the method and parameters so readers can reproduce the result.
Pro Tip: Run a distribution check on your adjusted values. If any player’s PAdj per 90 is more than three times the league median, that player is likely an extreme possession outlier and warrants manual review before publication.
For a practical match analysis checklist that situates PAdj within a broader workflow, Betsyscore’s 2026 guide covers the full analytical sequence.
Key Takeaways
Possession-adjusted stats normalize defensive counts to a 50/50 baseline, making cross-system player comparisons valid where raw counts are not.
| Point | Details |
|---|---|
| What PAdj does | Scales raw defensive counts to a neutral possession baseline, removing opportunity bias from comparisons. |
| Linear vs. sigmoid | Linear scaling is simple but inflates at extremes; the StatsBomb sigmoid formula handles outliers more reliably. |
| Worked example result | Aké’s raw interceptions adjust down after possession context is applied, while Walker’s adjust up, reversing the apparent ranking under the sigmoid model. |
| Key limitation | PAdj normalizes volume, not quality; always pair it with action-success rates and pitch-location data. |
| Betsyscore application | Betsyscore provides live possession metrics and player ratings across 200+ competitions, supporting PAdj-informed analysis. |
Why PAdj is a lens, not a verdict
Possession-adjusted stats are one of the more defensible normalizations in football analytics, and the StatsBomb r-squared evidence supports their use at team level. The problem is that the method travels well beyond its original scope in practice. Analysts apply PAdj to event types where it was never validated, report adjusted figures without disclosing possession definitions, and treat the output as a quality signal rather than a frequency correction.
The sigmoid formula is genuinely better than linear scaling for extreme cases, but neither formula addresses what happens inside those defensive events. A defender who wins 40% of their tackles and one who wins 70% can produce identical PAdj interception counts. The number tells you how often they were involved; it says nothing about what happened next.
The most responsible use of PAdj combines it with at least two other dimensions: action success rate and pitch zone. A high PAdj interception count in the defensive third is a different signal than the same count in the middle third. Reporting one without the other is incomplete analysis, not wrong analysis.
Transparency about method is the non-negotiable part. If you publish PAdj figures, state whether you used linear or sigmoid scaling, which possession definition you applied, and what minimum-sample filter you set. Readers cannot evaluate the output otherwise.

Live possession data and player ratings on Betsyscore
Analysts working with PAdj need reliable, up-to-date possession figures as a starting point. Betsyscore delivers live possession metrics, minute-by-minute match stats, and detailed player ratings across the Premier League, La Liga, Bundesliga, Serie A, Champions League, and more than 200 competitions worldwide. The platform refreshes data every few seconds, making it practical for both pre-match preparation and post-match review.

For real-time possession figures and match stats to support your PAdj workflow, visit Betsyscore live and pull the data directly from any ongoing or recently completed match.
Authoritative sources and further reading
The sources below cover formulas, possession measurement methods, and empirical evidence for PAdj adoption.
| Source | What it contains |
|---|---|
| Wyscout Glossary — PAdj | Definition, Aké/Walker worked example, event-type scope |
| StatsBomb — Introducing PAdj | Sigmoid formula, r-squared evidence, original methodology |
| Hudl/StatsBomb Support — Possession | Pass-count possession definition, logistic formula documentation |
| SoccerAnalytics — PAdj | Linear scaling formula, intuition, and limitations |
| CVPRW 2019 — Ball Possession via Minimum-Cost Flow | Video-based and pass-detection possession methods |
| FIFA Training Centre — Possession vs. Defensive Styles | Possession-gap categories, World Cup 2022 and WWC 2023 analysis |
For the formulas and sigmoid parameters, start with StatsBomb and Hudl. For possession measurement methodology, the CVPRW paper and Hudl documentation are the most detailed. For contextualizing PAdj within playing style, the FIFA Training Centre analysis is the most empirically grounded.
FAQ
What are possession-adjusted stats in soccer?
Possession-adjusted stats normalize raw defensive counts (tackles, interceptions, clearances) to a neutral 50/50 possession baseline, correcting for the fact that players on low-possession teams face more defensive situations than players on dominant-possession teams.
How is possession calculated for PAdj purposes?
Most providers, including those using Opta-style event data, compute possession as team passes divided by total passes from both teams. StatsBomb documents this formula explicitly, and it forms the denominator in every PAdj calculation.
Does possession-based football affect how PAdj works?
Yes. Teams with extreme possession shares (above 65% or below 35%) produce the largest adjustments, and the linear formula can over-inflate those figures. The sigmoid formula used by StatsBomb compresses extreme values to reduce that distortion.
What is expected possession value in soccer?
Expected possession value (EPV) is a separate concept from PAdj. EPV estimates the probability that a possession sequence will result in a goal, assigning a value to each on-ball action based on its location and context. PAdj adjusts defensive counts for opportunity; EPV measures the quality of possession sequences.
How do I use PAdj to compare players across leagues?
Apply the same possession definition and formula to both leagues, set a consistent minimum-minutes filter (typically 900 minutes), and report the method and sigmoid parameters alongside the figures. Betsyscore’s player ratings pages provide league-level data across La Liga, the Bundesliga, and other competitions as a reference baseline.