Proven by a 2026 Study: Build xT Weighted Pass Networks for Analysts
A passing network plots each player at their average position on the pitch and connects teammates with lines weighted by how often they exchanged passes. Analysts use it to read a team’s shape and its primary passing relationships at a glance. The catch: raw pass volume shows who touched the ball often, not who created danger, so the visualization works best paired with expected threat (xT) or progressive-pass data.
TL;DR:
- Passing networks are most insightful when paired with expected threat or progressive pass data to distinguish between safe recycling and genuine attacking connections.
- Building a meaningful network requires filtering data by success rate, pass volume thresholds, and calculating average positions to prevent visual noise and misinterpretation.
- Centrality metrics like betweenness or out-degree reveal key roles such as playmakers, pivots, or bridge players, but must be combined with aggressive pass data for accuracy.
- Dense or cluttered networks, especially on one flank, may reflect match tactics or game state rather than true attacking intent, requiring context and corroborating data.
- Valued pass networks weighted by expected threat better identify influential players who create scoring chances, especially midfielders, over simple pass count-based networks.
Table of Contents
- What Is a Pass Network in Soccer?
- How Do You Build a Pass Network From Match Data?
- What Do Network Metrics Reveal About Player Roles?
- Where Do Pass Networks Mislead You?
- What Is a Valued Passing Network and Why Does It Matter?
- What Tools and Code Should You Use to Build One?
- How Do Coaches and Analysts Actually Use These Networks?
- When Does a Passing Network Tell the Truth?
- Get Live Match Context to Pair With Your Network Analysis
- Sources
- FAQ
What Is a Pass Network in Soccer?
A pass network (also called a pass map) has two core components. Nodes represent each player’s average x,y position while they were on the field, usually sized by touches or pass volume. Edges are the lines between nodes, drawn between any two players who exchanged passes, with thickness typically encoding either raw pass count or a weighted value like combined xT.
Node color often layers in a third variable, such as pass completion rate or the direction of ball progression. Most networks apply a minimum threshold, showing only pairs that exchanged three or more passes, since plotting every single connection turns the image into visual noise.
Three variants show up regularly in analytics work:
- Team-level networks aggregate an entire half or match into one static image.
- Player-pair networks isolate a single relationship, useful for scouting a specific double-pivot or fullback-winger overlap.
- Temporal or rolling-window networks rebuild the graph every 10 to 15 minutes to catch tactical shifts as they happen.
Pass networks differ from two related tools worth knowing. A pass sonar shows directional tendencies for one player, radiating outward like a compass rose. A receiver map shows where a specific player tends to get the ball, which is handy for spotting a striker who drops into midfield or a wide forward who drifts into the half-space. Neither replaces the network. Each answers a narrower question.
How Do You Build a Pass Network From Match Data?
Building a basic network requires event data with pass start and end coordinates, passer and receiver identity, a timestamp, and an outcome flag for success or failure. Coordinate coverage varies by competition and data provider, and some feeds only carry event data without full player tracking, which limits how precisely you can place nodes for off-ball positioning.
Follow this sequence to go from raw events to a finished plot:
- Filter the dataset. Decide whether to include only successful passes (the common default) and set your time window: the starting eleven only, the full match, or a specific phase of play.
- Set a minimum-pass threshold. Most public examples use two or three completed passes between a pair before drawing an edge, which keeps the final image legible.
- Aggregate by player pair. Sum pass counts, or sum xT values if you are building a value-weighted version, for every unique combination of passer and receiver.
- Compute average coordinates. Calculate each player’s mean x,y position from their touches during the filtered window.
- Build the adjacency matrix and normalize. Scale edge thickness and node size so the visual differences are readable rather than dominated by one outlier pairing.
- Render the output. A static pitch plot works for reports; an interactive widget built in Plotly or D3 suits a dashboard where users hover for exact pass counts.
Pro Tip: Run the same match through two thresholds, one at two passes and one at five. The five-pass version usually isolates the two or three relationships that actually define the team’s structure, which is often more useful than the cluttered full picture.
What Do Network Metrics Reveal About Player Roles?
Once the graph is built, a handful of standard network measures translate the picture into numbers you can compare across matches or players.
- Degree and out-degree count how many distinct teammates a player exchanged passes with, and how many passes they sent out. A deep-lying midfielder with unusually high out-degree is often functioning as the team’s pivot, the player everyone funnels the ball through.
- Betweenness centrality flags players who connect otherwise separate parts of the team, such as a fullback who links the back line to an isolated winger. High betweenness without high degree often signals a bridge player rather than a primary hub.
- Density measures how interconnected the whole team is; a low-density network suggests the ball moves through a small number of predictable channels.
- Centralization captures how much the network depends on one or two nodes. A highly centralized team can look dominant in possession stats while being one injury away from losing its passing identity.
- Clustering shows whether small tight-knit groups (say, a back three and a deep midfielder) trade the ball mostly among themselves rather than distributing it wide.
None of these numbers mean much alone. A high out-degree pivot who only completes short, sideways passes is a very different player from one whose passes routinely advance the ball into the final third, which is why pairing network metrics with progressive-pass counts matters.
Where Do Pass Networks Mislead You?
The visualization has real blind spots, and treating it as a complete tactical read is the most common mistake analysts make.
- Averaging hides in-match changes. A single match-long network blends first-half and second-half shape into one blurry average, and it especially breaks down around substitutions, since a replaced player’s node position gets calculated only from their minutes on the field. The fix is to split networks by phase or possession window rather than relying on one full-match snapshot.
- Volume isn’t threat. A dense network with thick edges everywhere can just mean a team is comfortable recycling possession safely, not that it’s creating chances. Overlaying xT or progressive-pass data separates genuine attacking combinations from sideways security.
- Off-ball context is invisible. The network shows nothing about defensive shape, pressing triggers, or runs that didn’t result in a pass, which means cross-checking with tracking data, heatmaps, or match video is necessary before drawing conclusions.
Pro Tip: If a network looks unusually dense down one flank, check the scoreline and match state before calling it a tactical pattern. Teams protecting a one-goal lead often rack up harmless lateral passing that inflates edge thickness without creating anything dangerous.
What Is a Valued Passing Network and Why Does It Matter?
A frequency-based network answers “who passed to whom the most.” A Valued Passing Network (VPN) answers a sharper question: whose connections actually moved the ball toward scoring positions. Instead of counting passes, VPN sums the expected threat (xT) generated by each pass and uses that total to weight the edge between two players.
A 2026 study on contribution-based valued passing networks found that VPN out-degree centrality correlated with player performance ratings at r = 0.42 across all positions, rising to r = 0.51 for midfielders and r = 0.44 for forwards, using permutation testing for statistical validation.
That gap between overall and positional correlation tells you something practical: value weighting works especially well for midfielders, whose contribution often shows up in how they set up others rather than in raw touch counts. A player with modest pass volume but consistently high-xT connections will surface in a VPN as a genuine hub, while a frequency-only network would rank them below a teammate who simply touches the ball more often.
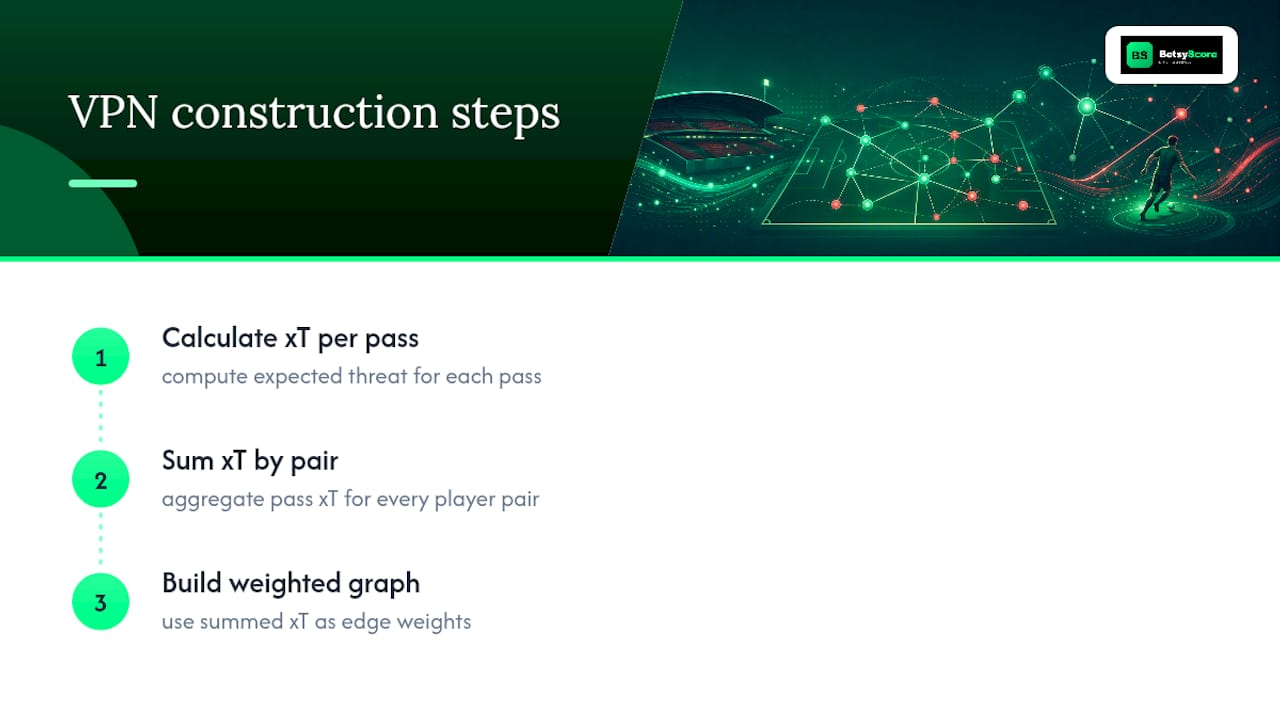
Implementing this is a straightforward extension of the basic workflow. Calculate xT value per individual pass, sum those values for every player pair instead of counting occurrences, and use the summed xT as your edge weight when constructing the graph. The related methodological literature covers pass-difficulty classification and time-window techniques that pair well with this approach.
What Tools and Code Should You Use to Build One?
The most common stack for building pass networks from scratch runs on Python: pandas for data wrangling, networkx for the graph math, and mplsoccer or matplotlib for static pitch plots. If you need something interactive for a dashboard, Plotly or D3 handle hover states and click-through filtering that a static image can’t.
A compact, repeatable workflow looks like this:
- Load the event data and confirm it includes pass start/end coordinates, passer and receiver IDs, and outcome flags.
- Filter to your chosen window and success criteria.
- Aggregate by player pair, either by count or by summed xT.
- Compute each player’s average position from their touches.
- Build the graph object and render it on a pitch template.
- Calculate degree, betweenness, and centralization from the same graph object.
The Soccermatics documentation walks through this exact sequence with runnable code, from data preparation through vertex placement to the final centralization calculation, making it the fastest path from theory to a working prototype in a single sitting. One common debugging snag: missing or null coordinates for a handful of events, usually caused by data-provider gaps rather than genuine off-pitch passes, so checking coordinate coverage before you aggregate saves a lot of confusion later.
How Do Coaches and Analysts Actually Use These Networks?
Passing networks earn their place in a workflow when they answer a specific question, not when they’re generated as a standalone graphic.
- Scouting focal partnerships. Recruitment analysts look for player pairs with consistently high-value connections across multiple matches, which flags creative relationships that raw stats miss.
- Diagnosing broken structure after substitutions. Comparing pre- and post-substitution networks quickly shows whether a tactical change reconnected an isolated player or made the problem worse.
- Live in-game adjustments. Coaching staff use rolling-window networks at halftime to check whether the game plan is actually producing the intended passing shape.
- Recruitment signals for creative passers. A midfielder with strong betweenness and healthy xT-weighted out-degree, even on a struggling team, often stands out as an undervalued target.
Before trusting any of these read-outs, ask: who is the hub, is that hub’s output actually reaching the forwards, and are the wide areas being exploited or just recycled? Pairing the visual with progressive-pass counts and a quick video clip usually confirms or kills the interpretation within minutes.
When Does a Passing Network Tell the Truth?
Networks are a genuinely useful diagnostic, but they’re a summary, not a verdict. A frequency-only graph can flatter a team that’s simply comfortable in possession, while a value-weighted version filters out that noise and points more reliably toward real attacking contribution. My take: treat the network as one panel in a review that includes xT, progressive passes, and actual match footage, never as the whole analysis.
— Aria
Get Live Match Context to Pair With Your Network Analysis
A pass network tells you who connected with whom. It doesn’t tell you what was happening on the scoreboard, how momentum shifted, or whether a team was defending a lead when that dense midfield network formed. Live lineups, minute-by-minute momentum tracking, and win-probability figures built from xG, recent form, and head-to-head records, all updated in real time, can fill that gap.

Use momentum swings to decide where to split your rolling-window networks, and check player profiles for the kind of recruitment context that turns a strong VPN out-degree number into an actual scouting lead. Betsyscore also covers progressive-pass data worth layering onto any network you build, plus a broader momentum framework for reading match flow. Head to Betsyscore’s live match pages to pull instant stats and lineups for the fixture you’re analyzing next, or check the AI predictions page for pre-match win-probability context before you start building.
Sources
- A contribution-based valued passing network for quantitative evaluation of player performance and coordination in football
- How to use passing networks in soccer
- Passing networks — Soccermatics documentation
- Pass Map in Football: Definition, Uses, and API Access - Sportmonks
FAQ
What Is a Pass Network in Soccer?
It’s a pitch diagram showing each player at their average position (nodes) connected by lines (edges) representing passes exchanged, with thicker lines indicating more passes or higher combined value.
What Are the Five Types of Passes in Soccer?
Common classifications include short passes, long passes, through balls, crosses, and lofted or chipped passes, each carrying different risk and reward that pass-value models like xT try to quantify.
What Are the Three Basic Types of Passes?
At the most basic level, coaches typically group passes into short/ground passes, long passes, and aerial passes such as crosses or chips, though passing networks themselves don’t distinguish pass type, only origin and destination.
Where Do You Put the Weakest Player in Soccer?
Coaches often position a technically weaker player at fullback or as a holding midfielder, roles with fewer high-pressure receiving situations, and a passing network can help confirm whether that player is being protected with lower involvement or is unexpectedly overloaded.
What Is the Hardest Position in Soccer?
Many analysts point to central defensive midfielder or center back, since both roles demand constant decision-making under pressure and typically show the highest degree centrality in a team’s passing network, meaning more of the game flows through them.