Every Few Seconds: Football Data Sources for Matchday Fans
For fans, football data sources are the live match trackers and platforms that deliver real-time scores, xG timelines, and AI win-probability so you can follow a game as it unfolds. The fastest way in is a single low-latency platform that bundles scores, lineups, expected-goals timelines, and win-probability in one place instead of juggling five tabs. This guide covers the types available, what separates a trustworthy source from a laggy one, and how BetsyScore fits that picture.
TL;DR:
- The fastest live football trackers update every few seconds, providing event-by-event detail and transparent methodology explanations.
- AI win-probability percentages should be accompanied by a published track record and avoid wild fluctuations without clear cause.
- Monitoring the xG timeline offers better insight into a team’s momentum than just watching the scoreline, especially after major events.
- Platforms like BetsyScore combine real-time scores, xG visualizations, and transparent prediction records to build trust with fans.
- Using multiple screens and viewing highlights after the match enhances understanding without risking live spoilers.
Table of Contents
- Types of Fan-Facing Football Data Sources
- What Separates a Trustworthy Live Data Source From a Laggy One?
- How to Use Live Data Sources During a Match
- BetsyScore as a Working Example of Fan-First Data
- What Raw Football Data Actually Looks Like Behind the Scenes
- Where Football Data Comes From Beyond Fan Apps
- Who Else Uses Football Data (and Why It Matters to Fans)
- How Football Data Gets Licensed and Accessed
- A Note on Watching Smarter, Not Just Watching More
- See Live Scores and AI Predictions for Yourself
- Sources
- FAQ
Types of Fan-Facing Football Data Sources
Not every football data source does the same job, and mixing the right combination changes how much you actually understand about a match versus how much you’re just watching numbers scroll by.
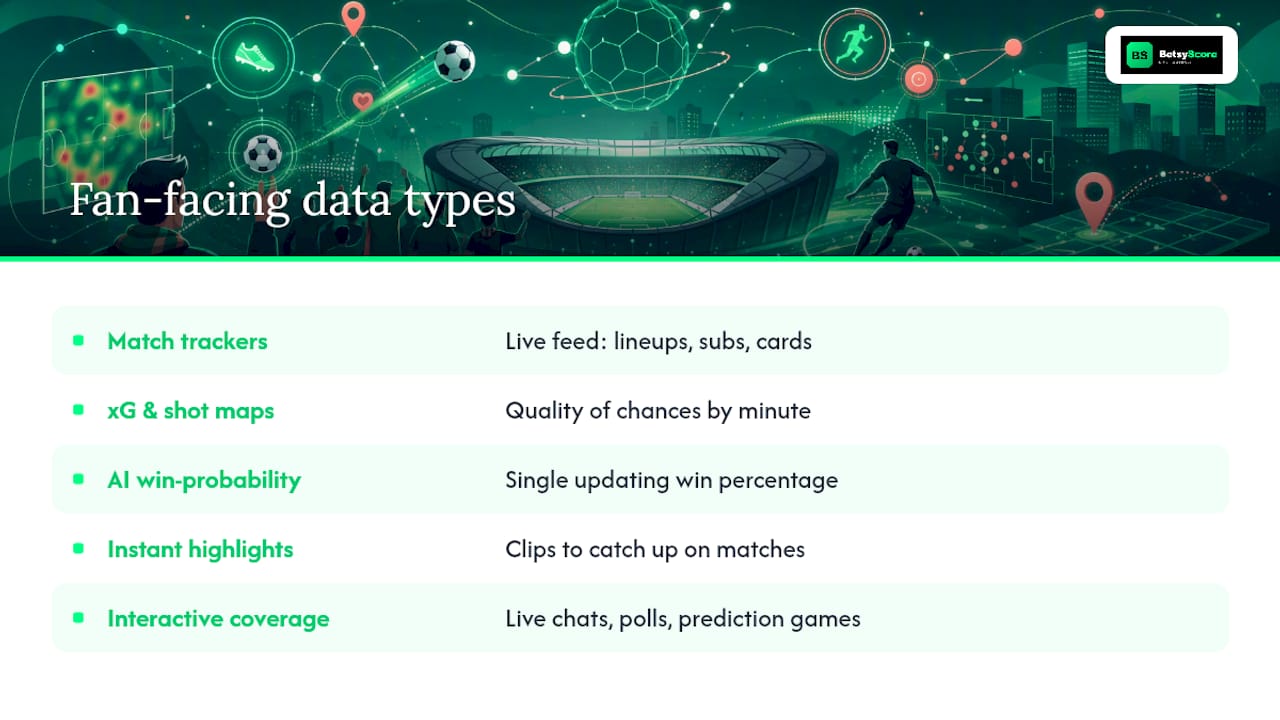
Match trackers are the backbone. They show the live event feed, starting lineups, substitutions, and cards as they happen, and they’re the best tool for following the structural shape of a game: who’s coming off, who’s getting booked, and when momentum shifts on the bench.
Expected goals (xG) timelines and shot maps go a level deeper. Instead of just telling you a team had “a lot of chances,” an xG timeline shows the quality of those chances accumulating minute by minute, which is often the difference between a team that’s genuinely dominant and one that’s just taking hopeful long shots. A team down 1-0 with an xG timeline showing 2.1 to 0.4 is a team that’s been unlucky, not outplayed.
AI win-probability pages translate all of that into a single number: a percentage that updates as the match develops. Watch for sudden swings after red cards or late goals.
Instant highlight clips solve the most common real-world problem fans have: inconvenient kickoff times. Reporting on World Cup 2026 viewing habits found that live viewing stayed dominant even as fans leaned on highlights and replays to catch up, meaning clips complement live football rather than replace it.
Interactive, creator-led coverage rounds it out: live chats, polls, and prediction games that turn a solitary viewing habit into something social. A survey of UK football fans found real appetite for exactly this kind of enhanced, interactive experience, including personalized stats and alternative viewing angles.
What Separates a Trustworthy Live Data Source From a Laggy One?
Latency is the first thing to check, and it matters more than most fans realize. A study on World Cup fan frustration found that seeing a result on social media before it showed up on your own screen was one of the most common complaints during the tournament. A tracker running 90 seconds behind the actual broadcast doesn’t just feel slow, it actively spoils the match for you.
Run through this before trusting a new platform with your matchday:
- Check the update speed. Sub-minute refresh rates are the baseline for goals, cards, and substitutions.
- Look for granularity. A good source shows event-by-event detail, not just a scoreline that jumps every few minutes.
- Find the methodology page. Any platform showing xG models or AI predictions should explain, in plain language, how those numbers get calculated.
- Check for a prediction record. If a site claims AI-driven win probabilities, it should show you how those predictions have performed historically.
- Test the interface on mobile. Cluttered layouts and buried timelines make quick glances during a match harder than they need to be.
Pro Tip: If a platform’s win-probability number jumps around wildly for no visible reason (no goal, no card, no obvious shift in play), that’s usually a sign of a shallow model rather than a genuinely responsive one. Consistent, explainable movement is the mark of a source worth trusting.
Interestingly, fans don’t actually demand zero delay. Research on viewer tolerance for sports latency found that a small lag becomes forgivable when a platform adds real value on top of it, like instant highlights or alternative camera angles. Speed matters, but speed paired with substance matters more.
How to Use Live Data Sources During a Match
Getting the most out of a football data source isn’t about opening an app and staring at it for 90 minutes. It’s about a rhythm.
Before kickoff: Follow the match page and save your teams so alerts arrive automatically. Review the starting lineups for tactical surprises. A manager benching a first-choice striker or switching formation tells you what to expect before a ball is even kicked.
During the match:
- Watch the xG timeline to read momentum rather than relying on the scoreline alone.
- Check win-probability after major events to understand how much a red card or late goal actually shifted the outcome.
- Use highlight clips sparingly if you’re watching live. Checking them mid-match risks spoiling what you haven’t seen yet.
- Monitor cards and disciplinary events, since a second yellow often forces a tactical reshuffle worth anticipating.
Multi-screen setup: Put the tracker on a phone or tablet next to your main screen, mute non-essential notifications so goal alerts don’t get buried, and use picture-in-picture if your setup supports it. This is how most fans actually watch big matches now, glancing at a live tracker rather than switching between apps.
After the final whistle: Instant highlights, player ratings, and updated leaderboards give you the recap and context that the live feed alone doesn’t. Before you trust any platform’s predictions long term, do one quick check: does it publish a methodology page and an actual prediction record? If it doesn’t show its work, treat its percentages as entertainment, not analysis.
BetsyScore as a Working Example of Fan-First Data
BetsyScore was built around exactly this checklist. The platform delivers real-time scores, AI win-probability percentages, minute-by-minute momentum tracking, live lineups, player profiles, and instant highlights across more than 200 competitions, from the FIFA World Cup 2026 to the Premier League, La Liga, Bundesliga, Serie A, and the Champions League.
Transparency check: BetsyScore publishes methodology explainers alongside a dedicated prediction record for World Cup 2026, letting fans see how the win-probability model has actually performed rather than taking accuracy on faith.
That combination maps directly onto the trust checklist covered above:
- Low-latency score updates that refresh every few seconds, not every few minutes.
- xG-informed momentum visualizations instead of a bare scoreline.
- Win-probability percentages tied to a published, checkable track record.
- Post-match archives, including tournament leaderboards, for deeper reading once the final whistle blows.
A platform that shows its methodology and its track record is doing something most live-data apps skip entirely, and that’s the gap fans should be checking for before they trust any prediction percentage.
What Raw Football Data Actually Looks Like Behind the Scenes
The scores and momentum charts fans see are the finished product of several distinct data types working together. Event data captures discrete moments: goals, passes, tackles, cards, and substitutions, each logged with a timestamp and location. Tracking data is different and far denser. It records the x/y coordinates of every player and the ball, often 25 times per second, which is what makes possible things like distance covered, sprint counts, and defensive-line positioning.
Then there’s the distinction between raw stats and analytics. A stat is a count: shots, corners, tackles won. Analytics is interpretation built on top of those counts, like expected goals, which weighs a shot’s distance, angle, and defensive pressure to estimate how likely it was to score, rather than simply logging that a shot happened.
This is also where the fan experience and the professional data world diverge. Fans mostly consume the finished output, a live score, a momentum bar, a win-probability number, built from analytics running underneath. Analysts and clubs work with the raw event and tracking layers directly. Understanding that distinction helps explain why one platform’s xG number might read slightly differently from another’s: they’re often built on different underlying tracking data and different shot-quality models, even when the box score looks identical.
Where Football Data Comes From Beyond Fan Apps
Fan-facing platforms don’t generate match data from scratch. They sit on top of a supply chain that starts well before any app displays a scoreline.
Official league and federation feeds sit at the top of that chain. Leagues and competition organizers often maintain or license the primary record of events (goals, cards, lineups) that gets distributed downstream to broadcasters and data platforms.
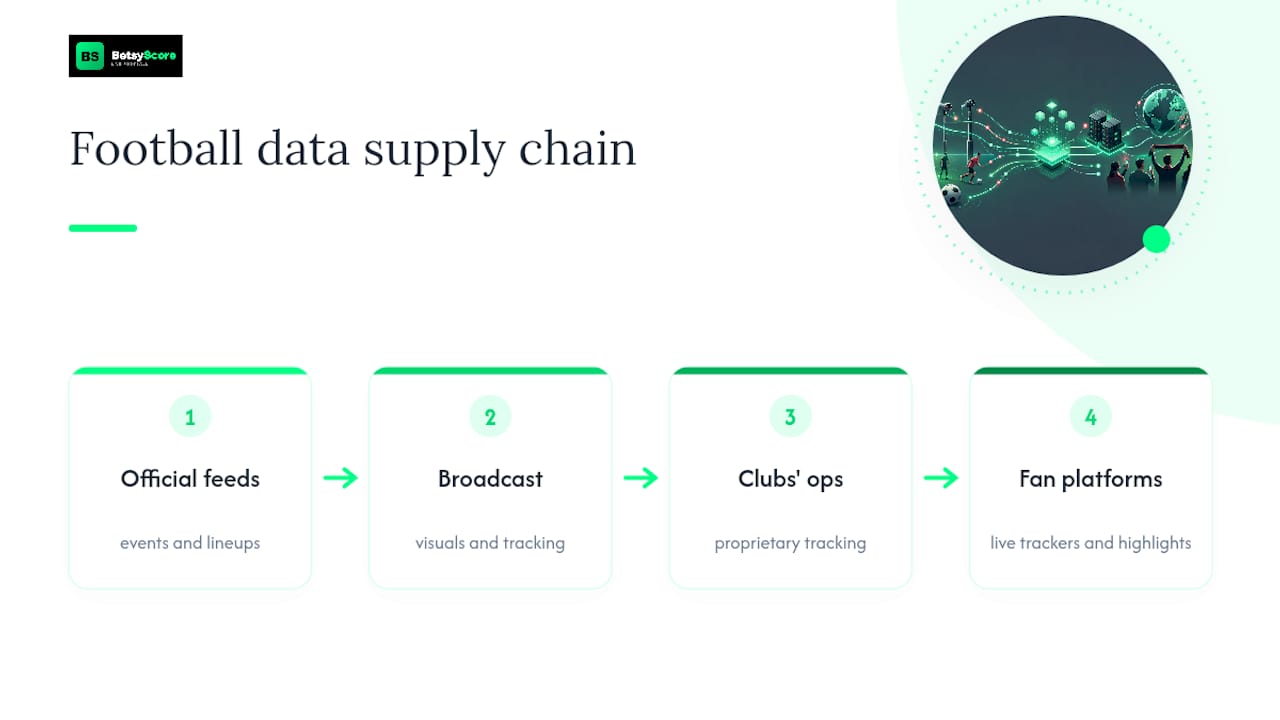
Broadcaster feeds add a second layer, particularly for anything visual. Camera angles, replay clips, and some tracking data originate with the broadcast production itself, which is part of why instant highlight clips on a fan app often trace back to broadcast partnerships rather than independent filming.
Clubs’ own data operations are the least visible layer to fans but increasingly important. Many top-flight clubs now run internal analytics departments that collect proprietary tracking data during training and matches, feeding recruitment, medical, and tactical decisions that never appear on a public scoreboard.
For the casual fan, none of this changes what shows up on a live tracker. But it explains why data quality varies between competitions: a top European league with dense broadcaster and federation infrastructure will generally have richer, faster fan-facing data than a smaller league with lighter production resources behind it.
Who Else Uses Football Data (and Why It Matters to Fans)
Fan-facing scores and predictions are the visible tip of a much larger use case list. Coaches and analysts use tracking and event data to break down opposition tendencies, adjust in-game tactics, and evaluate player fitness through sprint counts and distance covered. Scouts rely on the same underlying data, filtered through analytics models, to identify undervalued players whose output doesn’t match their reputation yet.
Betting markets are one of the largest commercial consumers of football data, using live event feeds and predictive models to set and adjust odds in real time as a match unfolds. Media organizations use the same raw numbers to build the graphics, timelines, and win-probability charts that eventually reach fans on platforms like BetsyScore.
What ties all of these together is a simple fact: the same underlying event and tracking data feeds every use case, just filtered through a different lens. A coach looking at a passing network and a fan looking at a momentum bar are, in a sense, looking at descendants of the same raw feed, interpreted for entirely different purposes.
How Football Data Gets Licensed and Accessed
Access to football data splits into a few distinct tiers, and where a source sits on that ladder shapes what it can offer. Proprietary licensing agreements sit at the top, where data providers negotiate direct access to official league and tracking feeds, then resell that access to broadcasters, clubs, and media platforms under commercial contracts.
Subscription and API access is the tier most developers and analysts interact with, where companies pay for structured access to event or tracking data at a defined refresh rate. Public and open datasets sit at the more limited end, covering historical match results, basic stats, and some open-source event data, useful for research but rarely fast enough or detailed enough for live matchday use.
For fans, none of this licensing complexity needs to be navigated directly. A well-built fan platform absorbs that access layer and turns it into a single clean interface. The question worth asking isn’t “how is this platform licensed,” but “does the finished product update fast enough and explain itself clearly enough to trust.”
A Note on Watching Smarter, Not Just Watching More
Here’s a habit worth adopting: check the xG timeline every match, even when the scoreline looks settled. A 0-0 draw with a 2.3 to 0.6 xG gap is a completely different story than a 0-0 draw with both teams sitting under 1.0, and only the timeline tells you which one you actually watched.
The two things I’d prioritize above everything else when picking a source are low latency and transparency. Speed without a visible methodology is just a fast guess. Try one new feature each match, a momentum bar, a lineup notification, a highlight reel, and pay attention to how it changes what you notice. Data doesn’t replace watching football. It sharpens what you see.
— Aria
See Live Scores and AI Predictions for Yourself
BetsyScore gives you what a raw data feed never will: scores, momentum, and AI win-probability updates you can actually read at a glance, refreshed every few seconds instead of every few minutes. No dashboards to configure, no API keys, just the match in front of you with the context built in.

Head to the live match center to see real-time scores and lineups update as the action happens, or check the AI predictions page to see win-probability percentages alongside the model’s actual track record. Pick a match kicking off today and follow it from the opening whistle. That’s the fastest way to see whether a data-first view of football changes how you watch.
Sources
Football data sources are live platforms that deliver real-time scores, lineups, xG timelines, and AI win-probability so fans can follow and understand a match as it happens. They differ from raw statistical databases in that everything is presented visually and instantly, built for watching rather than analyzing spreadsheets.
- Data tech frustrations fans fear most during World Cup
- Study: viewers willing to forgive sports latency if streamers add value to coverage
- World Cup 2026 Report
- Amdocs sports experience survey (summary)
FAQ
How Fast Should a Live Football Tracker Update?
The best trackers update within seconds of an event happening on the pitch, not minutes. Fan frustration during the World Cup largely traced back to seeing results on social media before a slow feed caught up.
Are AI Football Predictions Actually Accurate?
AI win-probability models use expected goals, recent form, and head-to-head history to generate a percentage, but accuracy varies by platform and by how transparent that platform is about its own track record. BetsyScore publishes a prediction record so fans can check performance rather than take the number on faith.
Do Highlight Clips Replace Watching Live?
No. Research on World Cup 2026 viewing habits found live viewing remained dominant even as fans used highlights to catch up on matches they missed. Clips work best as a complement for inconvenient kickoff times, not a substitute for live coverage.
What’s the Difference Between xG and a Regular Stat Like Shots?
A shot count just tells you how many attempts happened. Expected goals (xG) weighs each shot’s distance, angle, and defensive pressure to estimate how likely it was to result in a goal, which is why a team can lose a match while dramatically outscoring its opponent on xG.