What Does a Live Match Tracker Show Soccer Fans
A live match tracker is a digital tool that delivers real-time updates on ongoing soccer matches, including scores, match events, and advanced statistics, giving fans a complete picture of the action without needing a broadcast. Understanding what does live match tracker show separates fans who follow the score from fans who follow the game. Modern trackers, including Betsyscore, surface data points ranging from the match clock and event feed to AI-powered metrics like Expected Goals (xG) and live win probability, all refreshing continuously throughout the 90 minutes and beyond.
What does a live match tracker show: core features explained
A live match tracker displays the live scoreline, match clock with added time notation, and a running event feed covering goals, cards, substitutions, VAR reviews, and penalties. These are the foundational elements every tracker carries, and standard trackers update near real-time, often every 30 seconds, to maintain continuous coverage. That update frequency matters because a 30-second lag during a penalty shootout is the difference between knowing and guessing.
Beyond the scoreline, trackers display team statistics in real time. Shots on target, total possession percentage, corner count, fouls committed, passes completed, and goalkeeper saves all appear in the statistical panel. These numbers shift minute by minute as the match progresses, giving fans an objective read on which team is controlling the game.
Lineups and formations are also part of the standard display. Most trackers show confirmed starting elevens before kickoff and flag substitutions the moment they occur. Knowing that a manager has brought on a second striker in the 65th minute tells you far more about tactical intent than the scoreline alone.
The table below shows the core elements a quality live tracker displays and what each one tells you:
| Feature | What it shows |
|---|---|
| Live scoreline | Current goals scored by each team |
| Match clock | Elapsed time including added time (e.g., 90+4) |
| Event feed | Goals, cards, subs, VAR, offsides, penalties |
| Team stats | Shots, possession, corners, fouls, passes, saves |
| Lineups | Starting XI, formation, and live substitutions |
Pro Tip: Watch the added time display closely. Added time is a dynamic estimate influenced by referee decisions and ongoing stoppages, and a jump from 90+2 to 90+5 often signals that the trailing team is pushing hard, which means tactical shifts and set pieces are likely incoming.
Advanced features: AI metrics and interactive visualizations
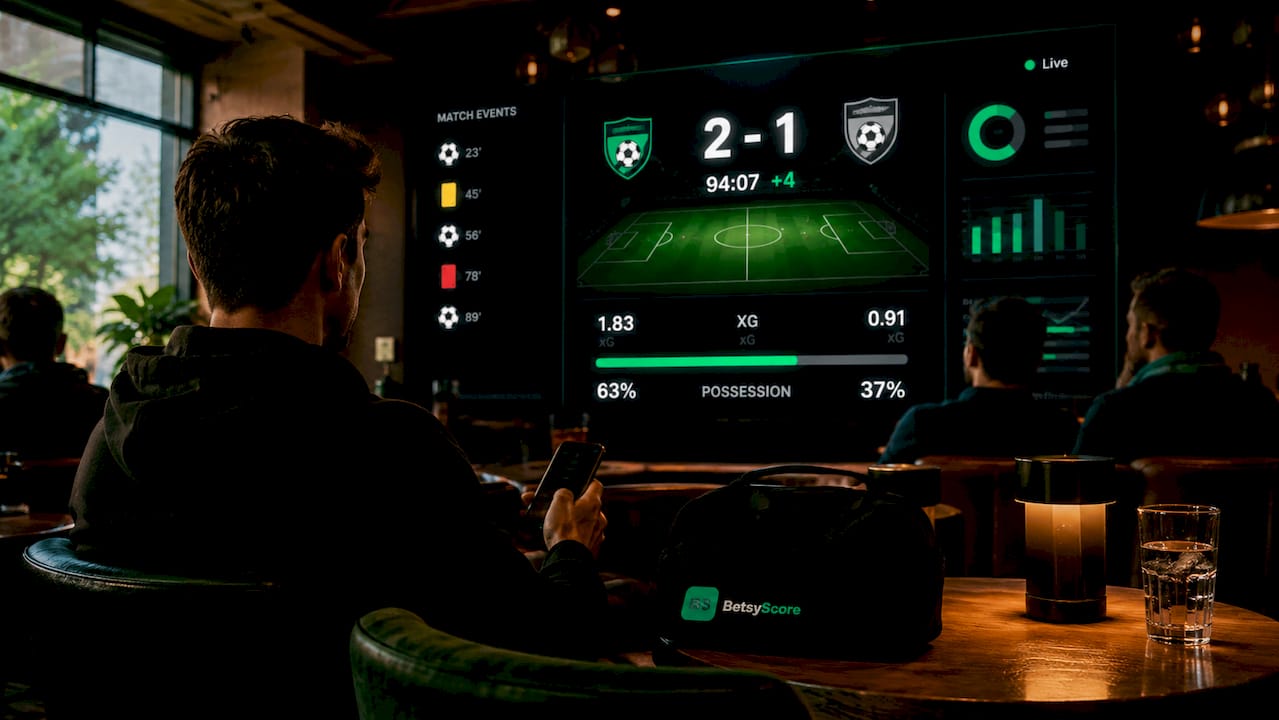
The most capable trackers go well beyond goals and cards. Advanced live trackers process over 3,000 data points per match, generating AI-powered metrics such as Expected Goals (xG) and live win probability maps. That volume of data means the tracker is effectively running a continuous scouting report on both teams throughout the match.
![]()
Expected Goals (xG) is the most widely cited advanced metric. It assigns a probability value to each shot based on factors like distance, angle, and assist type. A team with 1.8 xG but only one goal on the board is likely creating quality chances and may be due for a second. Live win probability updates that calculation every minute, factoring in the current score, time remaining, and recent match momentum.
The following advanced metrics appear on quality live match dashboards:
- Expected Goals (xG): Measures shot quality, not just shot volume
- Live win probability: A percentage updated continuously based on score, time, and form
- Momentum indicator: Shows which team has controlled the last 5–10 minutes of play
- Heat maps: Display where each team is most active on the pitch
- Passing lane visualizations: Show how teams are building attacks and where pressure is applied
- Player speed and positioning data: Track individual movement in real time
Opta Live’s platform combines live event data with decades of historical records to surface emerging storylines, offering broadcasters and fans advanced visualizations like shot charts and passing grids. That historical context is what separates AI-driven metrics from simple counting stats. A team’s xG in the 80th minute means more when you know their average xG in similar match situations across the previous three seasons.
Live match dashboards also display detailed timelines, momentum indicators, interactive charts, and team strategy markers, enabling fans to follow games on mobile devices while traveling or working. That accessibility is a defining feature of modern real-time tracking.
How to use a live match tracker effectively
Getting real value from a live tracker requires more than opening an app and watching the score tick up. Experts recommend a three-layer routine for match tracking: a primary score source for instant alerts, a commentary feed for tactical context, and a statistical panel for objective verification. Each layer serves a different purpose and together they give you a complete picture.
Follow this approach for each match:
- Set your primary score source. Use a platform like Betsyscore live scores as your main feed. It refreshes every few seconds and flags goals, cards, and VAR events the moment they occur.
- Add a commentary feed. Text commentary explains the context behind the numbers. A stat showing 15 shots may mean nothing until commentary confirms that 12 of them were blocked from outside the box.
- Open the statistical panel. Check possession, shots on target, and xG together. These three numbers give you a reliable read on which team is actually in control, regardless of the scoreline.
- Monitor lineup changes. Track substitutions as they happen. A defensive midfielder coming off for a second forward in the 70th minute signals a tactical shift that will show up in the stats within minutes.
- Verify VAR events before reacting. Trackers label VAR reviews clearly. Wait for the review to resolve before drawing conclusions about a disallowed goal or penalty decision.
Pro Tip: Possession percentage shows ball control, not offensive danger. Some teams deliberately concede possession to press high and attack on the counter. Always pair possession data with shots on target and xG before deciding which team is dominant.
Choosing a quality platform matters. Look for trackers that display xG alongside standard stats, update the match clock continuously, and label delayed or VAR-impacted events clearly. Betsyscore covers more than 200 competitions worldwide, including the Premier League, La Liga, Bundesliga, Serie A, and the Champions League, with AI-powered match predictions built from expected goals, recent form, and head-to-head records.
Common limitations and nuances in live match trackers
Trackers are summary tools. They are not replacements for live video, and treating them as such leads to misreads. Clear labeling of “delayed” or “VAR review” prevents fans from reacting to events that have not yet been confirmed. A goal that appears on the tracker may still be under VAR review, and the score could revert within seconds.
Data source quality also varies by platform. Trackers powered by reliable live score APIs automatically update match events and player stats in real time, but lower-tier platforms may rely on manual input, which introduces human error and lag. The difference shows up most clearly during fast sequences like a goal followed immediately by a VAR check.
The table below outlines typical tracker limitations fans should account for:
| Limitation | What it means for fans |
|---|---|
| Update delay (up to 30 seconds) | Score changes may appear slightly after the event |
| Dynamic added time | The clock may extend beyond the displayed added time |
| VAR review lag | A goal or card may be reversed after it appears on the tracker |
| Human data entry errors | Rare but possible on platforms without automated APIs |
| Feature gaps by platform | Not all trackers show xG, heat maps, or momentum data |
Added time notation deserves special attention. The display “90+5” is an estimate, not a fixed endpoint. Referees add time dynamically based on stoppages, and the tracker updates that estimate as the match continues. Fans who treat 90+5 as the final whistle will frequently be caught off guard by extended play.
Key Takeaways
A live match tracker shows far more than a scoreline: combining event feeds, team statistics, and AI-powered metrics like xG and live win probability gives fans a complete, real-time picture of any soccer match.
| Point | Details |
|---|---|
| Core display elements | Every tracker shows live score, match clock, event feed, team stats, and lineups. |
| AI-powered metrics | Advanced trackers process over 3,000 data points per match to generate xG and win probability. |
| Three-layer routine | Use a score source, commentary feed, and stats panel together for the most accurate read. |
| Possession misread risk | Possession percentage shows control, not danger; always pair it with xG and shots on target. |
| Tracker limitations | Update delays, VAR lag, and dynamic added time require fans to verify before reacting. |
Why I think most fans are only using half of what trackers offer
Most soccer fans open a tracker, check the score, and close it. That habit leaves the most useful information untouched. The xG column, the momentum bar, the heat map sitting one tab over: these are the features that tell you whether the scoreline is telling the truth.
I’ve watched fans celebrate a 1-0 lead at halftime while the tracker showed their team with 0.3 xG against the opponent’s 1.6. The scoreline was flattering. The data was honest. Fans who read both knew the second half would be uncomfortable, and it was.
The technology has also moved faster than most fans realize. AI-driven metrics that required professional scouting teams a decade ago now appear on a phone screen during the commute. Betsyscore’s momentum indicator, for example, updates minute by minute and shows which team has controlled recent play, not just who scored last. That distinction changes how you read a match entirely.
My practical advice: spend two minutes before kickoff setting up your three-layer routine. Check the soccer team stats and recent form, then open the live tracker when the whistle blows. By the 20-minute mark, the xG and possession data will tell you more about the match than the score ever could. Fantasy league managers and social viewers especially benefit from this approach because the stats give you specific, defensible talking points rather than gut reactions.
— Aria
Betsyscore and real-time match tracking for soccer fans
Betsyscore is built for fans who want more than a scoreline. The platform covers the FIFA World Cup 2026, the Premier League, La Liga, Bundesliga, Serie A, the Champions League, and more than 200 competitions, with scores refreshing every few seconds and AI predictions updating throughout each match.
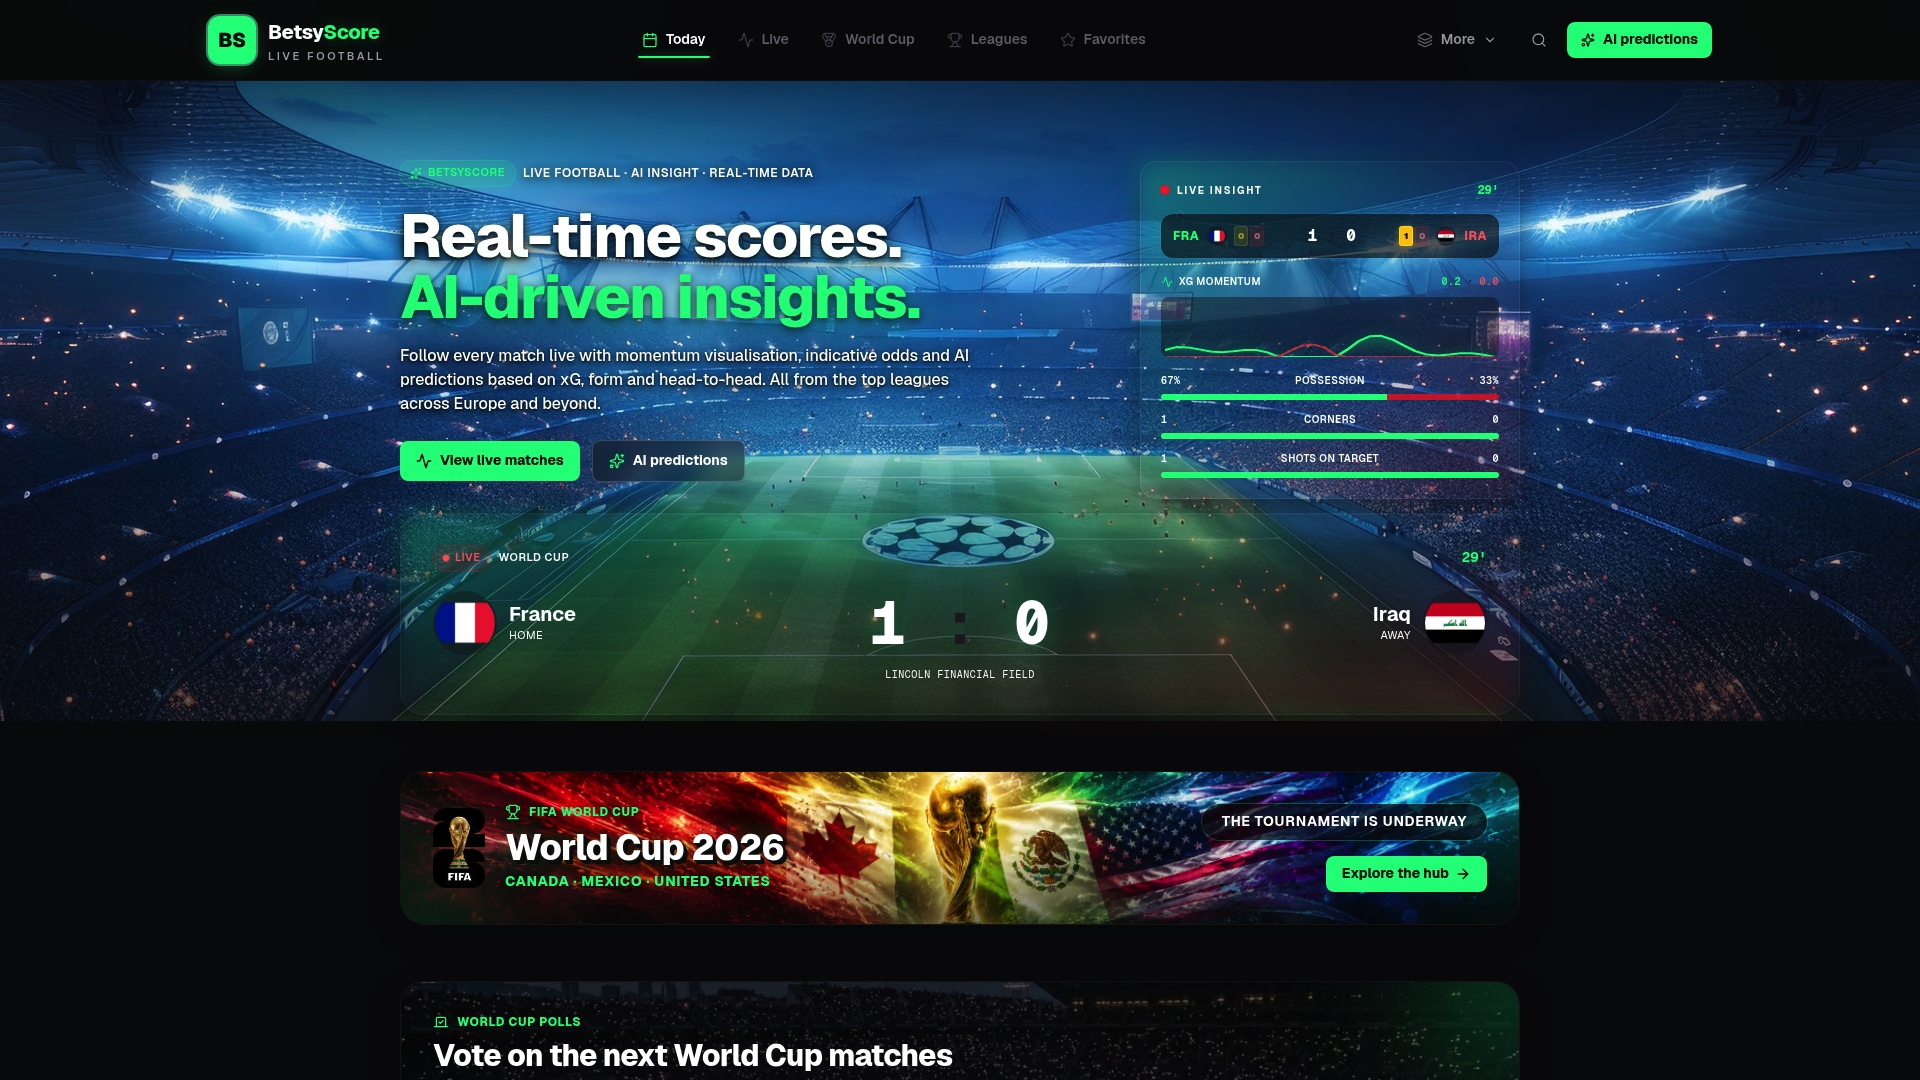
Every match page on Betsyscore displays live lineups, event feeds, momentum indicators, and win-probability percentages built from xG, recent form, and head-to-head records. Fans following the 2026 World Cup get dedicated trackers and AI-powered insights for every group stage and knockout match. For league-specific coverage, the Betsyscore leagues page gives you access to live trackers and standings across every major competition. Visit Betsyscore live now to follow any match in real time.
FAQ
What does a live match tracker show during a soccer game?
A live match tracker shows the live scoreline, match clock, event feed (goals, cards, substitutions, VAR), team statistics, and lineups. Advanced trackers also display Expected Goals (xG), live win probability, and momentum indicators.
How often does a live match tracker update?
Most quality trackers update near real-time, typically every 30 seconds, with some platforms refreshing score and event data every few seconds using automated APIs.
What is Expected Goals (xG) on a live tracker?
Expected Goals (xG) is a metric that assigns a probability value to each shot based on distance, angle, and assist type. It measures shot quality rather than shot volume, giving fans a more accurate read on which team is creating genuine scoring chances.
Can a live match tracker replace watching the game on video?
A live tracker is a summary tool, not a broadcast replacement. It delivers data and events accurately but cannot replicate the visual context of live video. Fans should use trackers alongside commentary feeds for the fullest understanding.
Why does added time on a tracker sometimes extend beyond the displayed number?
Added time is a dynamic estimate that referees adjust based on ongoing stoppages. The tracker updates the displayed figure as the referee signals additional time, so the final number often exceeds what appeared at the 90-minute mark.