xGOT Explained: MDPI Evidence and BetsyScore Live Signals for Analysts
xGOT (expected goals on target) measures the probability that an on-target shot becomes a goal, scored from 0 to 1 based on where the ball crosses the line. Unlike xG, which values a chance before the shot is struck, xGOT judges the shot itself. That distinction makes it the go-to tool for separating good finishing from good chance creation, and for grading goalkeepers on shots they actually face.
TL;DR:
- xGOT accurately measures shot execution quality by evaluating on-target shots, making it useful for assessing finishing and goalkeeper performance.
- Model differences, such as how blocked or deflected shots are handled, mean xGOT figures are not directly comparable across providers unless their methodologies are checked.
- Small sample sizes and high-proportion of blocked shots can cause volatility in xGOT, so the metric should be evaluated over multiple matches for reliable insights.
- Analyzing the gap between xG and xGOT reveals whether chances were wasted or well-executed, but it requires sufficient volume to draw meaningful conclusions.
- xGOT primarily reflects shot placement quality and should be used in conjunction with xG and shot volume for accurate player and team performance evaluation.
Table of Contents
- What xGOT Explained Really Means: Scope, Scale, and Alternate Names
- How xGOT Is Calculated: Inputs, Model, and What to Check
- How Analysts Actually Use xGOT
- Limitations and Common Caveats
- Practical Examples: When xG and xGOT Tell Different Stories
- How Betsyscore Uses Post-Shot Signals in Live Match Data
- When to Trust an xGOT Number, and When to Question It
- Sources
- FAQ
What xGOT Explained Really Means: Scope, Scale, and Alternate Names
xGOT only exists for shots that would have gone in without interference. That means shots on target, saved, or that hit the net. A blocked shot, a wide miss, or one that clears the bar never gets an xGOT value, because there’s no end location on goal to grade.
You’ll see the metric under a few different labels depending on the provider. Post-shot xG (PSxG) is the academic term most research uses, and in practice it means the same thing as xGOT. Some data feeds, including Sportmonks’ API, list it under a specific statistic type rather than folding it into standard xG output, which tells you vendors treat it as its own signal rather than a variant of the pre-shot number.
The naming breaks down like this:
- xGOT / Expected Goals on Target: the term most broadcasters and fan-facing platforms use.
- Post-shot xG: the phrase favored in academic and technical writing.
- PSxG: the shorthand you’ll see in spreadsheets, glossaries, and API documentation.
The core relationship to remember: xG asks “how good was this chance before the shot?” xGOT asks “how good was the shot itself, given where it ended up?” A player can rack up modest xG all game and still post a high xGOT if he keeps picking corners. That gap is the entire point of the metric.
How xGOT Is Calculated: Inputs, Model, and What to Check
Providers build xGOT models around a consistent set of inputs, even when the underlying math differs slightly from vendor to vendor. According to Stats Perform’s methodology, the typical inputs include:
- The shot’s original xG value (distance, angle, body part, assist type)
- The end coordinates of the shot as it crosses the goal line, or would have
- Shot trajectory and angle of approach to goal
- The goalkeeper’s position at the moment of the shot
- Contextual qualifiers such as deflection, shot power, and swerve
Most implementations run on logistic regression or a comparable classification model, trained on large historical samples of on-target shots. That training volume matters: a model built on a few thousand shots will behave very differently near the extremes (very close to the post, very high power) than one trained on hundreds of thousands. Providers have also started splitting models by competition gender rather than running one blended version, since shot speed, goalkeeper reach, and placement tendencies differ enough between men’s and women’s football to skew a shared model, a shift documented in Stats Perform’s expanded xGOT work.
Where providers diverge: the point at which coordinates get captured (exact goal-line crossing versus a nearby frame) and how blocked or deflected shots get classified. Some vendors exclude blocked shots from xGOT entirely; others assign a reduced value based on partial trajectory data. Neither approach is wrong, but they produce numbers that aren’t interchangeable. Before comparing an xGOT figure from one dashboard to another, check the provider’s own documentation on blocked-shot handling. That single detail explains most of the “why don’t these numbers match” confusion analysts run into.
How Analysts Actually Use xGOT
The most common application is measuring finishing quality independent of chance quality. Subtract cumulative xG from cumulative xGOT (a calculation Stats Perform and others formalize as Shooting Goals Added, or SGA) and you get a clean read on whether a player is placing shots better than the average finisher would in the same spots, as described in The Analyst’s breakdown of xGOT. A positive SGA means the player is out-finishing the raw chance quality; a negative one flags shots that are technically sound in creation but poorly executed.
Three practical workflows come up again and again:
- Finishing evaluation. Compare a striker’s xG total to his xGOT total across a season. A gap in favor of xGOT suggests placement and technique above what the chance alone deserved.
- Goalkeeper evaluation. Sum the xGOT of every shot a keeper faces, then compare that total to actual goals conceded. A keeper conceding fewer goals than cumulative xGOT suggests is outperforming the shots he’s seeing.
- Team-level shot quality. Track combined xG and xGOT trends over several matches to spot whether a team’s attack is generating good chances, good execution, or both.
Pro Tip: Never judge a player off a single match’s xGOT gap. Pair the metric with shot volume and xG per 90 across at least 8 to 10 matches before drawing any conclusion about finishing ability. A hot streak of three well-placed shots looks identical to elite finishing in a tiny sample, and the two are not the same thing.
Limitations and Common Caveats
xGOT is powerful, but it has real edges you need to respect.
- Only on-target attempts get a value, so a team generating high xG through blocked or off-target efforts won’t show that quality in xGOT at all.
- Provider models differ enough that raw scores aren’t directly comparable across data vendors without checking their documentation first.
- Small samples produce volatile numbers. A goalkeeper’s “goals prevented” figure over five matches can swing wildly and regress hard toward the mean by match day twenty.
- Defensive intervention (blocks, deflections, last-ditch clearances) muddies player-level interpretation, since a shot’s fate can change before it ever reaches the frame the model uses.
Treat any single xGOT number as one data point, not a verdict.
Practical Examples: When xG and xGOT Tell Different Stories
Three shot scenarios show why the gap between xG and xGOT matters in practice.
- Low xG, high xGOT. A striker hits a curling effort from 22 yards, a shot with modest pre-shot xG (say, around 0.06) because of distance and angle. He bends it into the top corner, just inside the post. The xGOT value climbs sharply above the original xG because the placement gave the keeper almost no chance, even though the chance itself was statistically weak.
- Moderate xG, low xGOT. A player gets a clean look inside the box, generating a healthy xG value near 0.30. He drills it straight at the goalkeeper’s chest. xGOT drops well below the original xG because a shot aimed centrally, regardless of power, is far easier to save than one placed toward a corner.
- Goalkeeper arithmetic. A keeper faces shots totaling 14.2 cumulative xGOT across a run of matches and concedes only 10 goals. That 4.2 gap is read as goals prevented, a simple subtraction that becomes one of the clearest single-number signals for keeper form over a stretch of games.
These three patterns cover most of what you’ll encounter reading match data: placement beating chance quality, chance quality wasted by poor placement, and cumulative shot-stopping performance measured against expectation.
How Betsyscore Uses Post-Shot Signals in Live Match Data
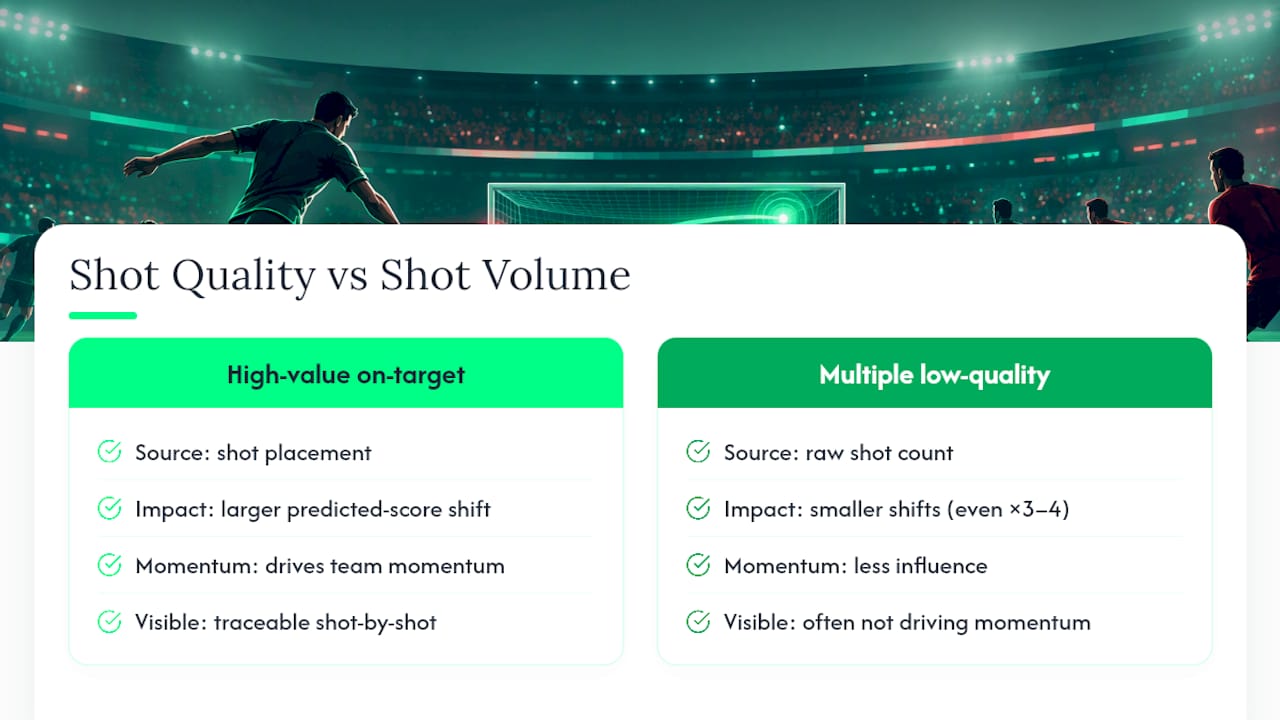
The platform’s live win-probability and momentum features run on expected-goal style inputs, updated continuously as a match unfolds. When a shot lands in a corner rather than centrally, that shift in execution quality feeds into how the platform reads momentum for the team that just created it, not only the raw shot count. A single high-value on-target attempt can move a predicted scoreline more than three or four low-quality efforts, because execution carries real weight in how the underlying signals get processed. You can watch this play out shot by shot on Betsyscore’s live match pages, where momentum shifts often trace directly back to a shot’s placement rather than its volume. For a deeper look at how expected-value metrics translate into live predictions, see how expected points connect to match forecasting.
When to Trust an xGOT Number, and When to Question It
xGOT earns your trust over large samples: a full season of shots, a goalkeeper who’s faced enough volume to smooth out variance, or a finishing pattern that repeats across dozens of attempts rather than three good games. Get suspicious when the sample is small, when you’re comparing numbers pulled from two different providers without checking their blocked-shot rules, or when a team faces an unusually high share of blocked efforts that never entered the calculation. The one-sentence takeaway: xGOT tells you about execution, xG tells you about opportunity, and you need both before you trust either one alone.
— Aria
Sources
Core sources: the MDPI xGOT study, Stats Perform’s xGOT methodology, and Sportmonks’ xGOT glossary entry. For product context, browse BetsyScore’s live matches or AI predictions.
- An Expected Goals on Target (xGOT) Metric as a New Metric for Analyzing Elite Soccer Player Performance
- What Are Expected Goals on Target (xGOT)?
FAQ
What’s the Difference Between xG and xGOT?
xG estimates the probability of scoring before a shot is taken, based on distance, angle, and assist type. xGOT recalculates that probability after the shot, using where the ball actually crosses the goal line, which is why The Analyst frames it as isolating chance creation from finishing execution.
Why Do People Say xG Is Flawed?
xG is a pre-shot estimate, so it can’t account for placement, power, or swerve once the shot is struck. That’s exactly the gap xGOT was built to close, using post-shot data instead of pre-shot probability alone.
What Counts as a “Big Chance” in Terms of xG?
There’s no fixed xG cutoff that universally defines a big chance. The MDPI research on xGOT notes that xG is continuous, and competitions or providers set their own thresholds rather than following one shared standard.
Is a Higher xG Always Better?
A higher xG generally means a better-quality chance, but it doesn’t guarantee a goal or even a shot on target. Pairing xG with xGOT and actual shot outcomes gives a fuller picture than either number alone, since a low-xG shot placed perfectly can outproduce a high-xG shot struck straight at the keeper.