Possession in Football: Definition, Calculation & Stats
Possession in football is a team’s control of the ball during active play, reported as a percentage share of the match and used by analysts to assess tempo, territorial dominance, and chance creation. Providers such as Opta track it through event-based sequence models, while broadcasters often display a live clock approximation. A high possession figure signals that a team dictated the rhythm of a game, but possession alone does not guarantee victory. Pairing it with expected goals (xG) and final-third metrics gives a far more complete picture of whether control actually translated into scoring threat.
Table of Contents
- How possession in football is calculated
- When does a possession start and end?
- Why TV possession numbers sometimes differ from post-match data
- What possession tells you tactically — and where it falls short
- Common ways teams lose possession
- What possession percentages look like in practice
- How Betsyscore shows possession and momentum in live coverage
- Key Takeaways
- Possession as context, not verdict
- Useful sources
- FAQ
How possession in football is calculated
Three distinct methods exist, and knowing which one a provider uses explains most of the variation fans see across different broadcasts and data feeds.

1. Clock-based (time-on-ball) percentage The simplest approach: analysts measure the cumulative seconds each team controls the ball, then divide by total active playing time. Stoppage time is typically excluded from the denominator, though practices vary. The result is a clean percentage that is easy to display live.
2. Pass-share Before roughly 2017, many providers estimated possession by dividing a team’s completed passes by the total passes in the match. The method is straightforward to automate, but it misses non-pass possessions such as dribbles, knock-ons, and ball carries, which means it can undercount a team that advances primarily through running rather than short combinations.
3. Event/sequence-based (Opta-style) The current industry standard. A possession sequence begins the moment a player makes a controlled touch and ends when control is lost through a defined turnover event: an interception, a completed tackle, a shot that results in an opponent restart, the ball going out of play, a foul, or a goalkeeper claim. Trained data scouts tag each controlled touch in real time or post-match, and the sequences are validated before the final numbers are published.
Worked example: a 90-minute match
- Team A completes many more passes than Team B. Pass-share assigns a higher possession share to Team A.
- Under the sequence model, coders log more possession sequences for Team A. Team A’s share is higher accordingly.
- The clock model records that Team A controlled the ball for a larger share of active minutes.
Small differences between methods are normal; each measures possession from a different angle.
| Method | Team A | Team B |
|---|---|---|
| Pass-share | 60% | 40% |
| Sequence-based | 62% | 38% |
| Clock-based | 60% | 40% |
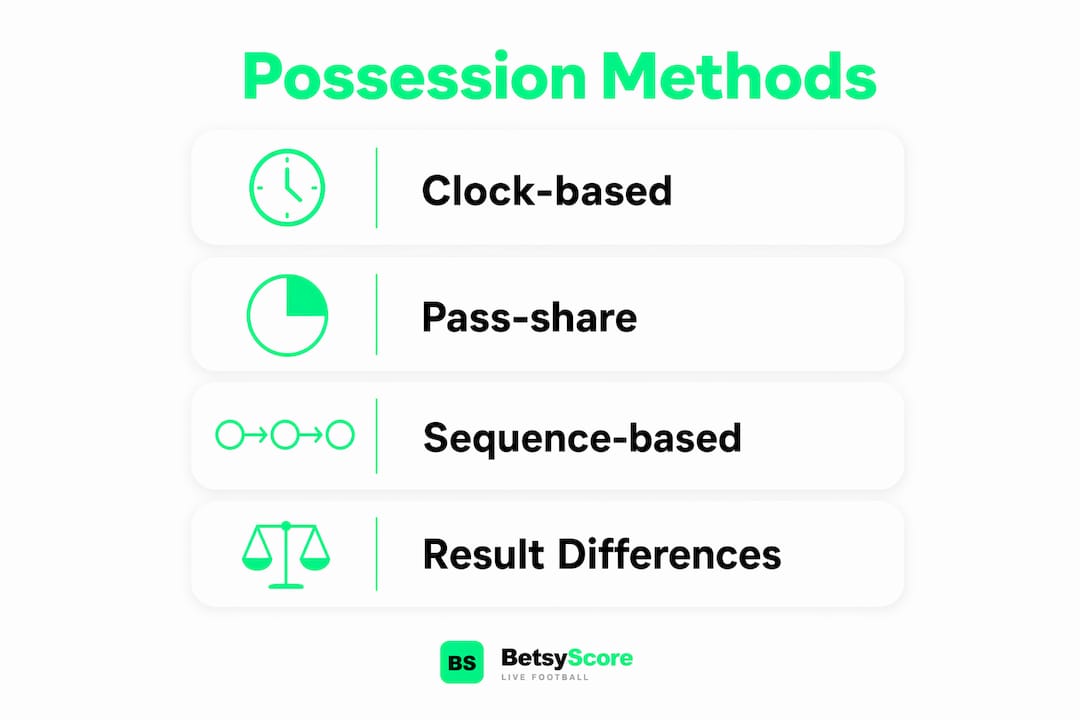
Small differences like these are normal. Larger gaps appear when one team relies heavily on dribbles or when stoppage time handling differs between providers.
When does a possession start and end?
A possession begins any time a player establishes clear control of the ball: receiving a pass with a settled first touch, winning the ball cleanly from a tackle, collecting a goalkeeper’s distribution, or restarting from a set piece. The key word is controlled. A ball that deflects off a player’s shin without intent does not typically open a new possession sequence in vetted data models.
A possession ends when control transfers to the opposing team or play stops. The most common end events are a successful tackle or interception, a pass that goes directly to an opponent, a shot that results in a goal kick or corner, the ball crossing a touchline, a foul that awards a free kick to the other side, or a goalkeeper claiming a cross.
Edge cases complicate the accounting. Contested aerial duels, where neither player cleanly wins the header, are often coded as a neutral event until one team establishes the next controlled touch. Deflected shots that loop to a teammate are generally credited as a continuation of the original sequence rather than a new one. Referee stoppages for injuries pause possession accounting entirely; the clock or sequence counter resumes only when the ball is back in active play.
Why TV possession numbers sometimes differ from post-match data
Fans watching a Premier League or Champions League broadcast occasionally notice that the on-screen possession graphic shifts to a different figure in the post-match report. The gap is real, and it has a straightforward explanation.
The main sources of mismatch:
- Method difference: Live TV graphics often use a clock-based approximation updated every few seconds. Post-match feeds from analytics vendors use validated sequence-based counts, which can produce a slightly different split.
- Data source: Broadcasters pull from a live feed that may not yet reflect human validation. Official post-match data has been reviewed by trained coders who correct misclassified touches.
- Rounding and averaging: Some broadcasters display possession rounded to the nearest whole number; others average across five-minute windows, which smooths short-term swings.
- Stoppage handling: Whether injury time, VAR delays, and substitution pauses are included in or excluded from the denominator varies by provider.
When accuracy matters, post-match data from a vetted analytics provider is the more reliable figure. Live graphics are useful for tracking momentum in the moment, but they should not be treated as the final record.
What possession tells you tactically — and where it falls short
High possession generally indicates that a team controlled the tempo of the match, kept the opposition from building attacks, and managed fatigue by limiting the opponent’s time on the ball. Teams that consistently hold the ball in the middle and attacking thirds tend to create more chances, and research across elite seasons found overall possession correlated with performance at r = 0.794 in a four-season sample.
That correlation, however, does not mean possession causes winning. A team can hold 65% of the ball by recycling passes across its own defensive line, generating no forward threat whatsoever. FIFA’s training materials explicitly note that more possession may reduce directness and invite counter-attacks, particularly against compact low-block defenses. Analysts at The Athletic have described raw possession as “the most dangerous statistic in football” when it is divorced from chance-quality metrics.
The complementary metrics worth watching alongside possession:
- Expected goals (xG): Measures the quality of chances created, not just the volume of ball retention.
- Possession Value (PV) / xT (expected threat): Estimates how much each possession sequence increases scoring probability, making it a direct measure of whether control was productive.
- Final-third entries: Counts how often a team moved the ball into the attacking third, separating territorial possession from safe recycling.
- Shot quality and shot locations: Contextualizes whether possession produced dangerous attempts or speculative long-range efforts.
Sportmonks recommends pairing possession with xG and final-third metrics specifically because those figures explain match outcomes more reliably than raw ball-retention figures alone.
Pro Tip: When a team finishes a match with 60%+ possession but a low xG, check where that possession was concentrated. Possession in the defensive and middle thirds rarely translates to goals; possession in the final third almost always does.
Common ways teams lose possession
Turnovers happen through a short list of recurring events, each with its own tactical context.
- Tackle / dispossession: A defender wins the ball cleanly from a dribbling attacker.
- Interception: A midfielder reads a pass and cuts the passing lane before the ball reaches its target.
- Failed pass: The ball goes directly to an opponent, either through poor weight, direction, or decision-making.
- Shot leading to opponent restart: A shot saved by the goalkeeper or blocked out for a goal kick ends the attacking sequence.
- Ball out of play: A wayward cross or dribble that goes into touch transfers possession via a throw-in.
- Foul: A foul committed by the team in possession awards a free kick to the opposition.
- Goalkeeper claim: The opposing goalkeeper catches a cross or shot, immediately starting a new sequence for their team.
A high-press team like Liverpool under Jürgen Klopp targeted turnovers in the opponent’s defensive third by pressing immediately after losing the ball, forcing rushed clearances and misplaced passes. A structured defensive team, by contrast, sits in a compact shape and waits for the attacking team to force a pass into a congested area, winning the ball through interceptions rather than aggressive pressing. Both approaches produce turnovers; the tactical philosophy determines where on the pitch they happen.
What possession percentages look like in practice
Most professional matches settle in a moderate possession range for the dominant team, reflecting roughly balanced competition. A notably higher share suggests one team controlled the game without overwhelming the other. Much larger differences typically indicate a significant tactical imbalance: one side either chose to sit deep and defend, or the other was clearly superior in technical quality.
Single-match extremes do occur. Dominant teams in one-sided fixtures have recorded very high possession when the opposition adopted a purely defensive posture. In those cases, the high possession figure reflects the opponent’s tactical choice as much as the dominant team’s quality.
The strong correlation between possession and performance found in elite-level research confirms that sustained high possession is generally associated with better outcomes, but the direction of causation is not straightforward. Teams that are already winning tend to hold the ball more, which inflates possession figures in the second half of matches where the scoreline is already settled.
How Betsyscore shows possession and momentum in live coverage
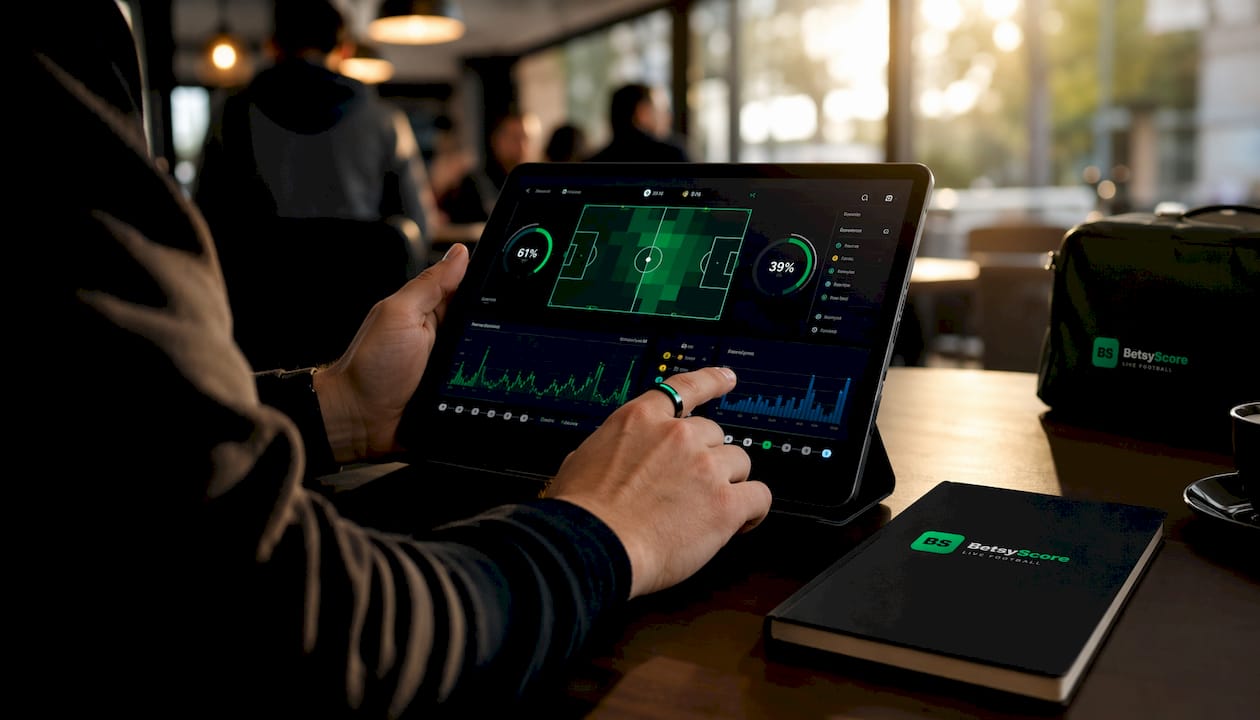
Betsyscore surfaces possession data as part of a broader live match experience designed to give fans context, not just numbers. During any live match, the platform displays a real-time possession percentage that updates alongside the match clock, so fans can track how control shifts across the 90 minutes.
Key product features that connect possession to deeper analysis:
- Minute-by-minute momentum visualization: A rolling chart that shows which team is on top at each stage of the match, drawing on possession, shots, and other live events.
- AI-powered match predictions: Win-probability percentages built from xG, recent form, and head-to-head records, with possession feeding into the model as a tempo signal.
- Live lineups and instant stats: Full squad data and in-match statistics available from kickoff, so possession figures can be read alongside the tactical setup that produced them.
- Coverage across 200+ competitions: From the FIFA World Cup 2026 and the Champions League to La Liga, Bundesliga, and Serie A, possession data is available across the full range of competitions Betsyscore tracks.
Pro Tip: During a live match on Betsyscore, cross-reference the possession gauge with the momentum chart. A team gaining possession share in the final 20 minutes while the momentum bar shifts in their favor is a reliable signal that pressure is building, regardless of the current score.
For fans who want to apply possession data to match analysis, Betsyscore’s AI predictions page shows exactly how possession-related inputs combine with xG and form to produce live probability estimates.

Track possession live across every major competition at Betsyscore.
Key Takeaways
Possession in football measures a team’s share of ball control during active play, but its tactical value depends entirely on where that possession occurs and whether it produces genuine scoring threat.
| Point | Details |
|---|---|
| Core definition | Possession is a team’s percentage share of ball control during active play. |
| Three calculation methods | Time-based, pass-share, and event/sequence models each produce slightly different figures. |
| Sequence model is standard | Since roughly 2017, Opta-style sequence-based counting with human validation is the industry benchmark. |
| Possession has real limits | High possession without final-third entries or xG is often tactically sterile. |
| Pair with xG and PV | Expected goals and Possession Value reveal whether ball retention actually threatened the opponent’s goal. |
Possession as context, not verdict
Raw possession figures are one of the most widely cited statistics in football broadcasting, and one of the most frequently misread. A team finishing a match with 65% possession has clearly dominated the ball, but that number says nothing about whether the control was productive. The more revealing question is always where the possession happened and what it generated.
The habit worth building: when you see a possession figure in a post-match report, immediately check the xG split and the final-third entry count alongside it. A team with 40% possession and an xG of 2.1 against an opponent with 60% possession and an xG of 0.6 almost certainly deserved the better result, regardless of what the possession graphic suggested during the broadcast. Possession describes control; xG describes threat. Both are necessary; neither is sufficient alone.
Useful sources
- Ball possession — Sportmonks glossary: Concise definition of possession as a tactical metric, with notes on its relationship to tempo and chance creation.
- How Is the Possession Stat Calculated In Football? — Analyisport: The most detailed publicly available breakdown of pass-share vs. sequence-based methods, including how data scouts tag controlled touches.
- Does Possession Lead to Winning in Football? — Sportmonks: Examines the relationship between possession and match outcomes, with a strong case for pairing possession with xG and final-third metrics.
- Possession: The most dangerous statistic in football — The Athletic: Influential analytical piece arguing that possession without chance-quality context can actively mislead tactical interpretation.
- How important is possession? — FIFA Training Centre: FIFA’s own coaching and research perspective on the tactical trade-offs of possession-based play.
- Evidence for a new model of the complex interrelationship of ball possession, physical intensity and performance — Wiley/SMS: Peer-reviewed study finding a strong correlation (r = 0.794) between overall possession and performance across elite seasons.
- Possession (sports) — Wikipedia): Broad overview of possession rules across multiple sports, useful for understanding how football’s definition compares to other codes.
- Post-Match Stats Worth Reviewing After Every Game — Betsyscore: Practical guide to the key post-match metrics fans should check, including possession, xG, and shot data.
Post-match data from vetted analytics providers remains the most reliable source for final possession figures. For live visualization during a match, Betsyscore tracks possession and momentum in real time across more than 200 competitions.
FAQ
What is meant by possession in football?
Possession in football refers to a team’s control of the ball during active play, typically reported as a percentage of the total match time or sequences. It is used to measure which team dictated the tempo and territorial balance of the game.
How is football possession calculated?
The current industry standard uses an event/sequence model: a possession begins with a controlled touch and ends when a defined turnover event occurs, such as an interception, tackle, shot, or ball out of play. Before 2017, many providers used pass-share, dividing one team’s passes by the total passes in the match.
How do you lose possession in football?
The most common ways are a successful tackle or interception by the opponent, a misplaced pass that goes directly to an opposing player, a shot that results in a goal kick or corner, the ball going out of play, or a foul that awards a free kick to the other team.
What is the longest possession in football history?
No universally verified single-match possession record is maintained in a standardized public database, as historical tracking methods varied significantly before sequence-based models became standard around 2017. Single-match figures well above typical moderate possession shares have been recorded in elite competition, but a definitive all-time record is not publicly established.
Does high possession guarantee winning?
No. Research shows possession correlates with performance (r = 0.794 in one elite-level study), but possession in a team’s own half or middle third rarely produces goals. Analysts recommend checking xG and final-third entries alongside possession to determine whether ball control actually created meaningful scoring opportunities.