Turn 75% Shootout Conversion Into Actionable Probability for Analysts
Penalty shootouts sit closer to a coin toss than a true test of soccer quality, but they are not pure chance. The headline number analysts return to again and again is a shootout conversion rate near 75%, well below the roughly 82% success rate for in-game penalties. Kicking first once looked like a meaningful edge; broader, more recent datasets show that advantage has largely evaporated.
TL;DR:
- Penalty shootouts have an average success rate of about 75%, which is lower than in-game penalties primarily due to more off-target misses caused by pressure.
- Early shootout kicks tend to convert at slightly higher rates, and designated specialists outperform makeshift takers, though the differences narrow in elite competitions.
- Kicking order and team strength have minimal impact on outcomes, with recent data showing success probabilities close to a coin toss and modest advantages for stronger sides.
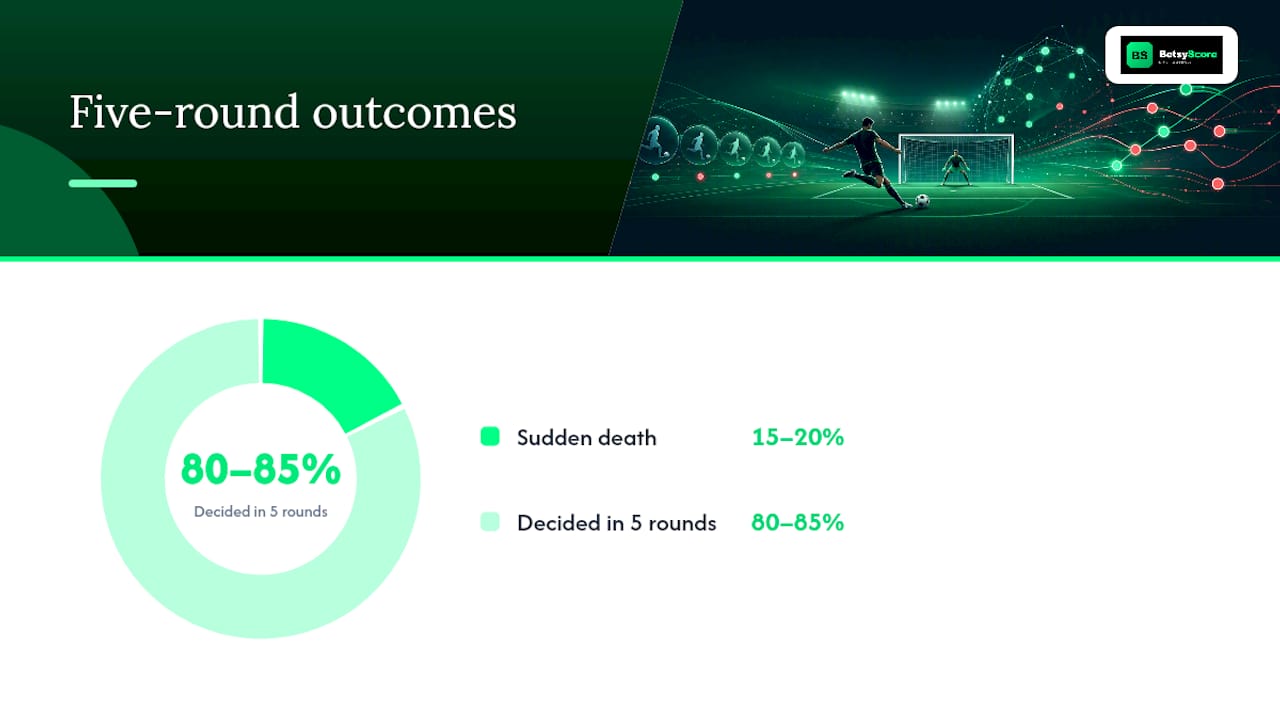
- The probability of reaching sudden death in a shootout is roughly 15% to 20%, influenced by the success rate per kick and the variability introduced in the final rounds.
- Trainers should focus on pressure simulation and individualized shot analysis, as most missed shots are rooted in nerves rather than goalkeeping ability.
Table of Contents
- Penalty Shootout Probability: What the Data Actually Shows
- Building a Probability Model: Binomial Math and Sudden Death
- Does Kicking Order or Team Strength Actually Matter?
- What Coaches and Analysts Should Actually Do With This
- How Betsyscore Tracks Shootout Probability in Real Time
- A Reflection on Randomness, Skill, and Shootouts
- Sources
- FAQ
Penalty Shootout Probability: What the Data Actually Shows
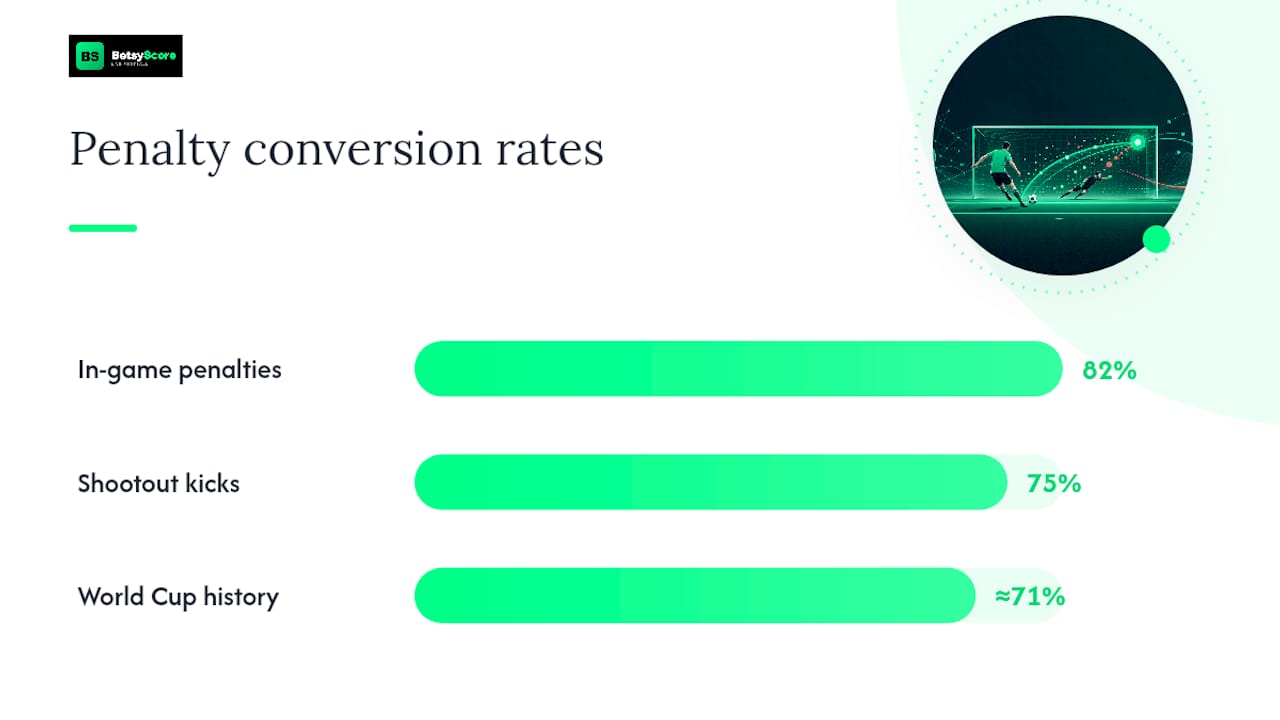
Soccer penalty statistics tell a consistent story once you compare shootout kicks against ordinary match penalties. In-game penalties convert around 82% of the time, but shootout kicks drop to roughly 75%, according to a PLOS One analysis of shootout penalties. That gap is not explained by better goalkeeping. The same research found the drop comes mostly from more off-target misses, not sharper saves, which points straight at pressure affecting the shooter’s technique rather than the keeper’s reflexes.
World Cup shootouts add texture to that baseline. Tournament almanacs tracking decades of penalty shootout history show conversion rates in the high 60s to mid 70s depending on the sample window, with notable dips in early rounds for players taking their first competitive spot kick under global broadcast pressure.
A few patterns emerge consistently across shootout win probability research:
- Earlier kicks in the five-round sequence convert at slightly higher rates than kicks five and six, when fatigue and stakes compound.
- Designated penalty specialists outperform makeshift takers, though the gap narrows in elite competitions where most squads carry multiple reliable shooters.
- Sudden-death kicks show more variance because sample sizes per round are small and the pool of remaining takers often includes weaker options.
Shootout success rate snapshot: shootout kicks convert at roughly 75%, versus roughly 82% for in-game penalties. The World Cup 2026 tournament will add a fresh batch of shootouts to the historical pool, and BetsyScore’s prediction record from the tournament tracks how those new results shift the running averages.
One caution matters here: shootout samples are small relative to open-play penalties. A handful of tournaments can swing an aggregate conversion figure by a percentage point or two, so treat any single-competition stat as a data point, not gospel.
Building a Probability Model: Binomial Math and Sudden Death
The simplest way to estimate penalty shootout probability is a binomial model. Assume five kicks per side, each kick independent, each with the same success probability p. Set p at 0.75, the empirical shootout conversion rate from the PLOS One study, and you can calculate the full distribution of goals scored across five attempts.
Here is how that plays out step by step:
- Set the assumptions. Independence between kicks, a fixed p per kicker, and no order effect. Real shootouts violate all three to some degree, but the model still gives a useful baseline.
- Calculate the five-kick distribution. With p = 0.75, the expected number of goals per team over five kicks is 3.75. The probability both teams land on an identical score after five rounds (forcing sudden death) comes out to roughly 15% to 20% under this assumption, depending on rounding.
- Model sudden death separately. Once the shootout enters sudden death, each round is a fresh binomial trial with one kick per side. Analytic work on shootout mathematics shows the expected number of total penalties depends heavily on p: a success rate near 50% actually minimizes the expected number of kicks, while rates near 75% or 90% push shootouts longer on average because ties keep recurring.
- Upgrade to Poisson-binomial when p varies by kicker. Real squads do not share one conversion rate. A specialist converting at 85% next to a nervous defender converting at 55% breaks the simple binomial’s equal-p assumption. A Poisson-binomial sum, or a quick Monte Carlo simulation across thousands of trials, handles that heterogeneity properly.
- Feed in observed history. Adjust each kicker’s p using their personal conversion record and the goalkeeper’s penalty save tendencies, rather than assuming league-average numbers for every taker.
Statistical snapshot: at p = 0.75 per kicker, five-round shootouts land in sudden death in roughly one out of every five to six shootouts, based on binomial calculations anchored to the PLOS One conversion figure.
The biggest limitation is that real p shifts under pressure, fatigue, and goalkeeper scouting, none of which a static binomial captures well.
Does Kicking Order or Team Strength Actually Matter?
Older shootout literature made a bold claim: the team kicking first wins about 60% of the time. That figure came from influential early work and got repeated for years as settled fact. It has not held up under later scrutiny.
Broader, more recent datasets tell a different story:
- A large-sample analysis of European club shootouts from 2000 to 2025 found outcomes approximate a coin toss, with no statistically significant effect from kicking order or in-shootout momentum.
- A separate summary of the shootout literature confirms the original 60/40 split has converged toward roughly 50/50 as sample sizes grew and covered more competitions and eras.
- Team strength still shows up, just modestly. Statistical work on penalty kicks and shootouts finds stronger sides win more often than weaker ones, but the edge rarely pushes past roughly 60%, even in significant quality mismatches.
Part of the shrinking first-mover effect likely reflects adaptation: coaches and federations have had decades to notice the pattern and coach around it, whether through mental preparation or simply choosing to kick second more deliberately when the coin favors them. Rule changes that have made shootouts more frequent in recent seasons also widen the sample in ways that dilute older, smaller-sample findings. When reading any single study’s effect size, check the sampling window first. A dataset built entirely from 1970s and 1980s tournaments will report different numbers than one built from 2015 to 2025, and neither is wrong. They are measuring different eras of penalty-taking behavior.
What Coaches and Analysts Should Actually Do With This
The data points to a few concrete, usable decisions rather than vague caution.
On the coin toss itself: since kicking order shows no reliable advantage in modern large-sample data, there is no statistical reason to obsess over winning it. Choose based on your goalkeeper’s readiness and crowd conditions, not superstition about going first.
On shooter order, a few heuristics hold up:
- Put your most reliable, lowest-variance taker in one of the first two slots, since early misses compound psychological pressure on teammates who kick later.
- Save at least one calm, experienced option for kicks four and five, when stakes peak.
- Rotate your goalkeeper’s scouting report on the opposing lineup right up to the final substitution window, since late changes affect who actually steps up.
Pro Tip: Train shootout scenarios with genuine external pressure, an actual crowd, scoreboard, and consequence, rather than isolated placement drills. The PLOS One data points to missed shots, not saved shots, as the main driver of lower shootout conversion, so accuracy under stress is the real skill to drill.
For pre-shootout analysis, a useful report covers each kicker’s historical conversion rate, the goalkeeper’s post-shot expected goals against penalties, and a live win-probability estimate rather than a static coin-flip framing.
How Betsyscore Tracks Shootout Probability in Real Time
Static pre-match models only tell part of the story once a shootout actually starts. Betsyscore’s live win-probability figures update after every kick, folding in expected goals, recent form, and head-to-head history so the percentage on screen reflects what just happened rather than what was expected before the first ball was struck.
That kick-by-kick updating matters because a shootout is not one probabilistic event. It is a sequence of five to twelve independent ones, and each miss or save meaningfully reshapes the odds for everything that follows. A few things worth knowing about how that plays out in practice:
- A momentum indicator can show which side is controlling the moment, useful context heading into a shootout that follows 120 minutes of even football.
- Live win-probability percentages may recalculate immediately after each attempt, rather than waiting for the shootout to finish.
- The methodology behind these models, including how Brier scores are used to check calibration, is broken down in Betsyscore’s win probability modeling guide.
Readers who want to see how historical sample size shapes these forecasts can also check how historical data informs modern prediction models, the same principle underlying every shootout study cited above.
A Reflection on Randomness, Skill, and Shootouts
Calling shootouts “a lottery” undersells them. They are high-variance, not random. Skill still shows up in the aggregate, even if any single shootout can go either way. The right response is not fatalism. It is better preparation: training for pressure specifically, building live probability into pre-match planning, and being honest with players that a miss reflects nerves and mechanics under stress, not bad luck alone.
— Aria
Sources
- Penalty shoot-outs are tough, but the alternating order is fair | PLOS One
- Are penalty shootouts better than a coin toss? Evidence from international club football in Europe
- Statistical perspectives on penalty kicks and shootouts (PMC)
- Statistical analysis of penalty shootout history (summary article)
FAQ
What is the average success rate for penalty shootouts?
Shootout kicks convert near 75% on average, based on the PLOS One analysis of penalty outcomes. That is noticeably lower than the roughly 82% conversion rate for in-game penalties, mostly because of more misses under pressure rather than better goalkeeping.
What are the key statistics for penalty shootouts?
The core numbers are a 75% shootout conversion rate against an 82% in-game penalty rate, and a first-mover win rate that has converged close to 50% in large modern datasets. Older research once put the first-kicker advantage near 60%, but that gap has narrowed as sample sizes grew.
Is a penalty shootout basically a 50/50 chance?
For most evenly matched teams, yes, shootouts land close to a coin toss once kicking order is accounted for. Stronger teams retain a modest edge in some datasets, but research on penalty kicks and shootouts shows that edge rarely exceeds roughly 60%, even against clearly weaker opponents.
What percentage of penalty shots are scored in soccer?
In-game penalties convert around 82% of the time, while shootout penalties convert near 75%, according to the PLOS One study. The gap comes primarily from shooters missing the target under shootout pressure, not goalkeepers making more saves.