How Historical Data Shapes Modern Football Predictions
Historical match records and derived metrics supply the baseline probabilities that prediction models update with live context. That is the role of historical data in football predictions, in one sentence: it builds the starting point, and everything else — team news, tactics, form — adjusts from there.
Three things follow from that:
- Priors come from the past. A model’s first guess at a result comes from long-run results, not from this week’s headlines.
- Feature engineering decides quality. Raw history means little until it’s converted into recency-weighted form, opponent-adjusted stats, and head-to-head splits.
- Old data goes stale fast. Transfers, managerial changes, and injuries can break a pattern that held for years — a caution any serious model has to build in.
Betsyscore applies these same principles in its live prediction pipeline, blending archived match data with real-time inputs to generate win probabilities.
Key Takeaways
Historical data supplies the baseline probability that every football prediction model refines with live context, feature engineering, and validation against real outcomes.
| Point | Details |
|---|---|
| History sets the baseline | Long-run results and derived stats form the starting probability before live factors adjust it. |
| Feature engineering does the heavy lifting | Recency-weighted and opponent-adjusted features turn raw history into usable model inputs. |
| Non-stationarity is the biggest risk | Transfers, injuries, and format changes can break patterns that held for years. |
| Validation separates real signal from noise | Brier score, log loss, and time-based backtesting confirm whether a model actually works. |
| Betsyscore applies this pipeline live | Its AI predictions combine multi-season archives with real-time lineup and match events. |
Table of Contents
- What Role Does Historical Data Play in Football Predictions?
- How Does Historical Data Improve Prediction Accuracy?
- Which Statistical and Machine-Learning Models Use Historical Data?
- What Are the Biggest Pitfalls of Using Historical Data?
- How Is Historical Data Used in Betting and Analytics?
- How Do You Measure Whether a Prediction Model Actually Works?
- How Betsyscore Applies Historical Data to Live Predictions
- Where to Learn More About Football Data Modeling
- What the Data Actually Tells Us
- See How Historical Data Powers Live Predictions on Betsyscore
- Sources
- FAQ
What Role Does Historical Data Play in Football Predictions?
Historical data, in this context, means every recorded trace of past matches: final scores, event-level detail like shots and passes, tracking coordinates, and the contextual metadata around them. It’s the raw material every prediction model, from a simple spreadsheet to a neural network, has to start with.
The main types analysts pull from:
- Match results — scorelines, dates, venues, competition stage.
- Event data — shots, passes, tackles, cards, substitutions.
- Expected goals (xG) — a shot-quality metric that’s become a standard proxy for performance beyond the scoreline.
- Player stats and lineups — minutes played, positions, fitness status.
- Contextual metadata — weather, referee, travel distance, injuries.
- Odds history — how markets priced past matches, useful for calibration.
Sources range from free public archives and league APIs to commercial vendors like Opta, whose event-level datasets stretch back decades. Coverage and granularity vary enormously. A free CSV might give you scorelines going back to 1993; a commercial feed can give you every touch of the ball from last night’s match within minutes.
How Does Historical Data Improve Prediction Accuracy?
Turning a spreadsheet of old results into a usable prediction happens in four stages.
- Baseline priors. Long-run results establish a starting probability. A team that’s won 60% of its home games over five seasons carries that tendency into the model before anything else is considered.
- Feature engineering. Raw history gets reshaped into signals a model can actually use: recency-weighted averages (last five games weighted more than last fifty), opponent-adjusted metrics (goals scored against strong defenses count for more), and rolling xG differentials.
- Model training and validation. These features get fed into a statistical or machine-learning model, trained on one period and tested on another to check it generalizes.
- Live adjustments. Once a baseline probability exists, real-time inputs, a confirmed lineup, a red card, a late injury, shift it up or down.
Recency-weighted xG shows the home team has been creating better chances than that baseline suggests over the last ten matches. The feature nudges the probability upward before kickoff even happens. Home and away splits and player-availability data layer in the same way, each one refining the number rather than replacing it.
Which Statistical and Machine-Learning Models Use Historical Data?
Different model families lean on history differently, and picking the wrong one for your data is a common, avoidable mistake.
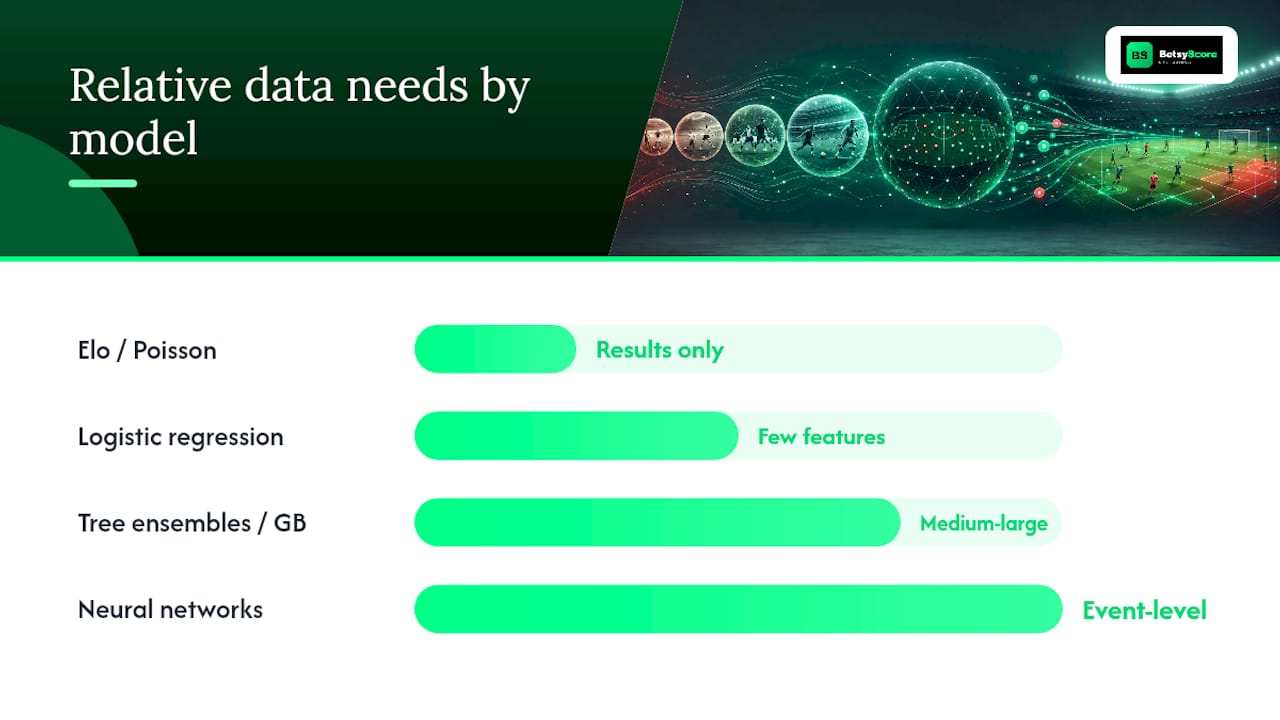
Poisson and Elo-style rating systems remain the backbone of a lot of practical prediction work precisely because they need relatively little data to function and are easy to interpret. Logistic regression sits a step up in complexity, handling more features but still explainable. Tree-based ensembles and gradient boosting can capture nonlinear patterns that simpler models miss, but they need larger, cleaner datasets to avoid overfitting. Neural networks go furthest, capable of learning from event-level and tracking data, but they demand the most data and the most careful validation.

| Model family | Typical data needs | Where it excels | Where it struggles |
|---|---|---|---|
| Elo / Poisson | Match results only | Fast, interpretable baselines | Misses tactical nuance |
| Logistic regression | Results plus a handful of features | Balancing simplicity and signal | Limited with nonlinear patterns |
| Tree ensembles / gradient boosting | Medium-to-large feature sets | Complex interactions, ranking factors | Overfits with sparse data |
| Neural networks | Large event-level or tracking datasets | Capturing subtle spatial patterns | Needs volume and heavy validation |
Whichever family you pick, a few safeguards keep the results honest:
- Never let future information leak into training data.
- Validate with rolling time windows, not random shuffles.
- Cross-validate by time period, not by match ID.
- Check that a feature’s predictive power hasn’t quietly decayed over recent seasons.
What Are the Biggest Pitfalls of Using Historical Data?
History is a guide, not a guarantee, and machine-learning research on sport prediction warns that relying on past results alone hurts a model’s ability to generalize once squads or tactics change.
The recurring problems:
- Transfers and squad turnover can make five years of head-to-head data almost meaningless overnight.
- Small-sample bias shows up constantly in cup competitions and newly promoted teams with thin histories.
- Data quality gaps appear in lower leagues where event data is inconsistent or missing entirely.
- Survivorship bias skews analysis toward teams and leagues with long, clean records, ignoring those that changed structure or dropped out.
- Format changes, like an expanded Champions League, break historical comparisons across seasons.
A workable mitigation checklist: weight recent matches more heavily, build injury-awareness directly into features, use ensembles rather than a single model, and version your datasets so you can trace exactly which data produced which prediction. On the ethics side, handling player-level tracking and health-adjacent data (injuries, fitness) responsibly matters. Treat it with the same care as any other personal performance record.
Pro Tip: Before trusting any model’s output, ask what season range it was trained on. A model trained entirely on pre-pandemic seasons may carry biases from a period with no fans in stadiums.
How Is Historical Data Used in Betting and Analytics?
Historical-data-driven predictions show up across the football industry in ways that go well beyond a single match forecast:
- Pre-match odds modeling, where bookmakers and analysts set opening lines.
- In-play probability updates, recalculating win chances as events happen.
- Player scouting and projection, using historical performance to forecast fit at a new club.
- Season simulations, running thousands of iterations to project final standings.
- Broadcast enrichment, surfacing historical stats and trends for commentary.
Bettors use these outputs mainly for value detection, comparing a model’s implied probability against the market’s odds to spot mispricing, and for calibrating expectations against public sentiment. Betting on football carries real financial risk, and no historical model removes that risk entirely; treat probabilities as informed estimates, not certainties. It’s worth noting that different applications need different data resolution. Scouting depends on granular player-tracking history, while long-run odds-making works fine on match-level archives alone.
How Do You Measure Whether a Prediction Model Actually Works?
Three metrics do most of the work in validating a football prediction model. Brier score measures the average squared difference between predicted probabilities and actual outcomes, rewarding models that are both accurate and well-calibrated. Log loss penalizes confident wrong predictions more heavily, exposing overconfidence.
Solid backtesting practice includes:
- Rolling-window validation instead of one static train/test split.
- Time-based cross-validation, so no future match ever informs a past prediction.
- Out-of-sample holdouts covering at least a full season.
- Reported confidence intervals, not just a single point estimate.
Reproducibility matters here too. Publishing the data coverage and evaluation windows behind a model lets other analysts check the work rather than take it on faith.
How Betsyscore Applies Historical Data to Live Predictions
Betsyscore’s prediction pipeline follows the same structure described above, just running continuously. Historical archives feed feature engineering (xG trends, current form, head-to-head record), which produces a baseline win probability before kickoff. From there, live inputs, a confirmed lineup, a sending-off, a goal, update that probability in real time, visible on the AI Predictions page.
- Baseline built from multi-season historical archives.
- Recency-weighted form and head-to-head features layered on top.
- Live events (lineups, cards, goals) trigger immediate recalculation.
Pro Tip: When a platform shows a probability, check whether it displays a range or band rather than a single flat number. A well-calibrated model should show some uncertainty, not false precision.
Where to Learn More About Football Data Modeling
- Football-data on historical data and betting fundamentals.
- StatsPerform’s Opta archives piece for provider-scale coverage detail.
- The academic survey on football data analytics for club-level adoption challenges.
- Betsyscore’s AI Predictions page to see the methodology applied live.
What the Data Actually Tells Us
The conventional pitch around football analytics oversells precision. Plenty of content treats a model’s output as a near-fact rather than a probability estimate built on inevitably incomplete history. That’s backwards. The real value of historical data isn’t that it makes predictions certain, it’s that it replaces guesswork and selective memory with something checkable, which is a meaningfully different claim.
Where most casual analysis falls short is recency handling. People love a five-year head-to-head record because it feels substantial, but a squad that’s turned over 60% of its personnel since then is practically a different team wearing the same badge. The research on model generalization backs this up directly: sole reliance on historical results without controllable context, tactics, personnel, form, degrades a model’s ability to handle exactly the situations where predictions matter most.
If you take one thing from this, prioritize recency and context over depth of history. A shallow but current dataset usually beats a deep but stale one. Domain expertise still earns its place here too, since interpreting why a trend broke often matters more than the trend itself.
See How Historical Data Powers Live Predictions on Betsyscore
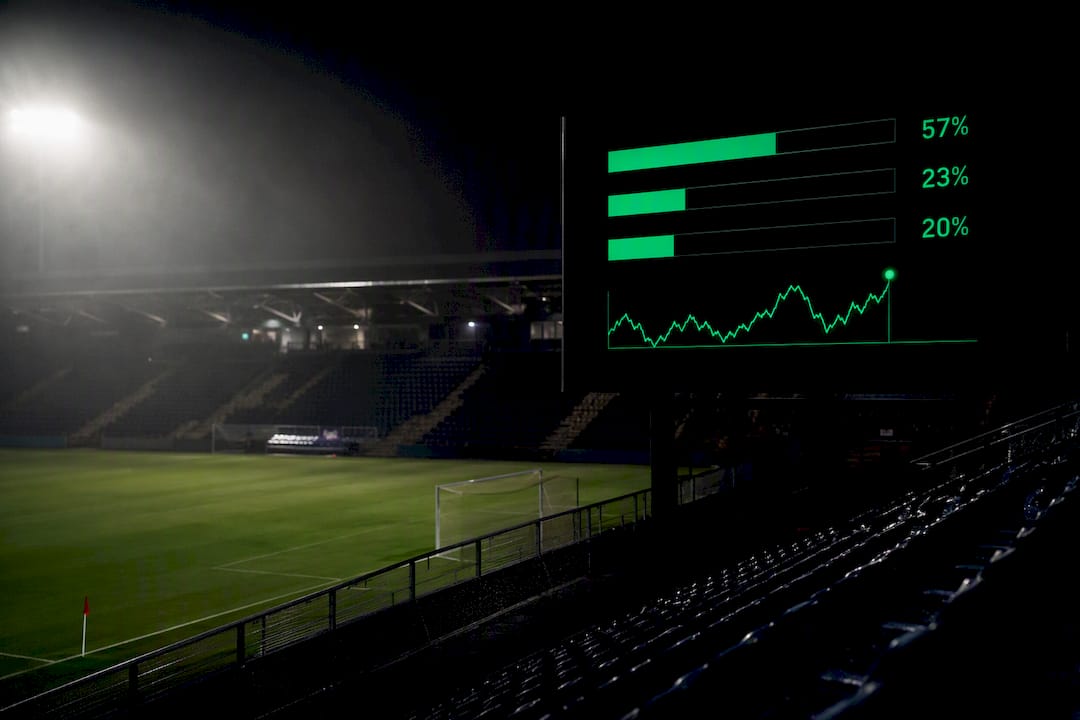
Betsyscore turns the mechanics covered above into something you can actually watch happen. Rather than reading about recency-weighted features in the abstract, you can see a win probability shift in real time the moment a lineup drops or a card gets shown, with the historical baseline and live adjustment both visible on screen.

Coverage runs across more than 200 competitions, from the Premier League and La Liga to the FIFA World Cup 2026. The same historical-data approach applies whether you’re tracking a title race or a group-stage upset. Check the AI Predictions page before your next match to see a live win-probability breakdown, then follow it through kickoff on the live scores hub to watch the model update as the match unfolds.
Sources
- The Role of Historical Data in Predicting Match Outcomes
- The Power of Historical Data: Unlocking Insights with Opta’s Archives
- Data analytics in the football industry: a survey investigating operational frameworks and practices in professional clubs and national federations from around the world
- PLOS ONE article on predictive model generalisation (machine learning in sport)
FAQ
Who is the most accurate football predictor?
No single model or provider is universally the most accurate. Accuracy depends on the competition, data depth, and time window measured, which is why calibration and Brier score comparisons matter more than any single claim of top accuracy.
How is data analytics used in football?
Clubs, broadcasters, and bettors use data analytics for scouting, tactical analysis, injury-risk modeling, and match-outcome prediction, built from historical event and tracking data. Betsyscore applies the same foundation to generate live win-probability updates during matches.
Can I use ChatGPT for football prediction?
ChatGPT and similar tools can help explain concepts like xG or summarize historical trends, but they aren’t trained on live match data and can’t calculate calibrated probabilities the way a dedicated prediction model can. For a live, data-driven probability, a purpose-built tool like Betsyscore’s AI Predictions is the more reliable option.
What is the best way to analyze football predictions?
Check three things: whether the model discloses its data coverage and time range, whether it reports calibration alongside raw accuracy, and whether probabilities update with live match events rather than staying fixed at kickoff.