Field Tilt for Analysts: Passes vs Touches and Live Momentum
Field tilt is the percentage share of all final-third action a team produces in a match. It measures whose attacking areas the game actually lived in, rather than who simply touched the ball more often. A team can dominate field tilt while trailing in possession, and that gap is exactly why analysts treat tilt as a sharper read on territorial control. The one caution worth holding onto early: tilt says nothing about chance quality, so it works best alongside expected goals (xG).
TL;DR:
- Field tilt often favors the attacking team even if possession is higher for the opponent, highlighting genuine territory control rather than ball circulation.
- Different providers’ zone definitions can cause tilt discrepancies of up to 10 percentage points when comparing two matches.
- Pairing tilt with expected goals (xG) helps distinguish between territorial control and actual chance quality, preventing misinterpretation of sterile activity.
- A team chasing a goal late in the game can have a high tilt despite being behind on the scoreboard due to increased final-third actions.
- Real-time momentum tracking and AI predictions offer dynamic insights into territorial dominance and game quality during live matches.
Table of Contents
- What Is Field Tilt? The Formula and a Worked Example
- How Analysts Track Tilt: Zones and Rolling Windows
- Why Field Tilt Matters More Than Raw Possession
- Short Scenarios Where Tilt Tells a Different Story
- Tactical Implications: How Coaches Use Field Tilt
- Building a Reliable Workflow: Pairing Tilt With xG and Game State
- Where Field Tilt Can Mislead You
- Seeing Field Tilt in Action on Betsyscore
- When I Reach for Field Tilt (and When I Don’t)
- Track Territorial Momentum Live on Betsyscore
- Sources
- FAQ
What Is Field Tilt? The Formula and a Worked Example
Field tilt formalizes territorial dominance into one number: the share of combined final-third passes or touches that belong to one team. The standard version of the formula looks like this:
- Count Team A’s final-third actions (passes or touches inside the attacking third).
- Count Team B’s final-third actions over the same period.
- Divide Team A’s total by the combined total of both teams, then multiply by 100.
Most providers default to passes because pass data is cleaner and more consistently logged across event feeds, though a touch-based version captures dribbles and receptions that passing data misses.
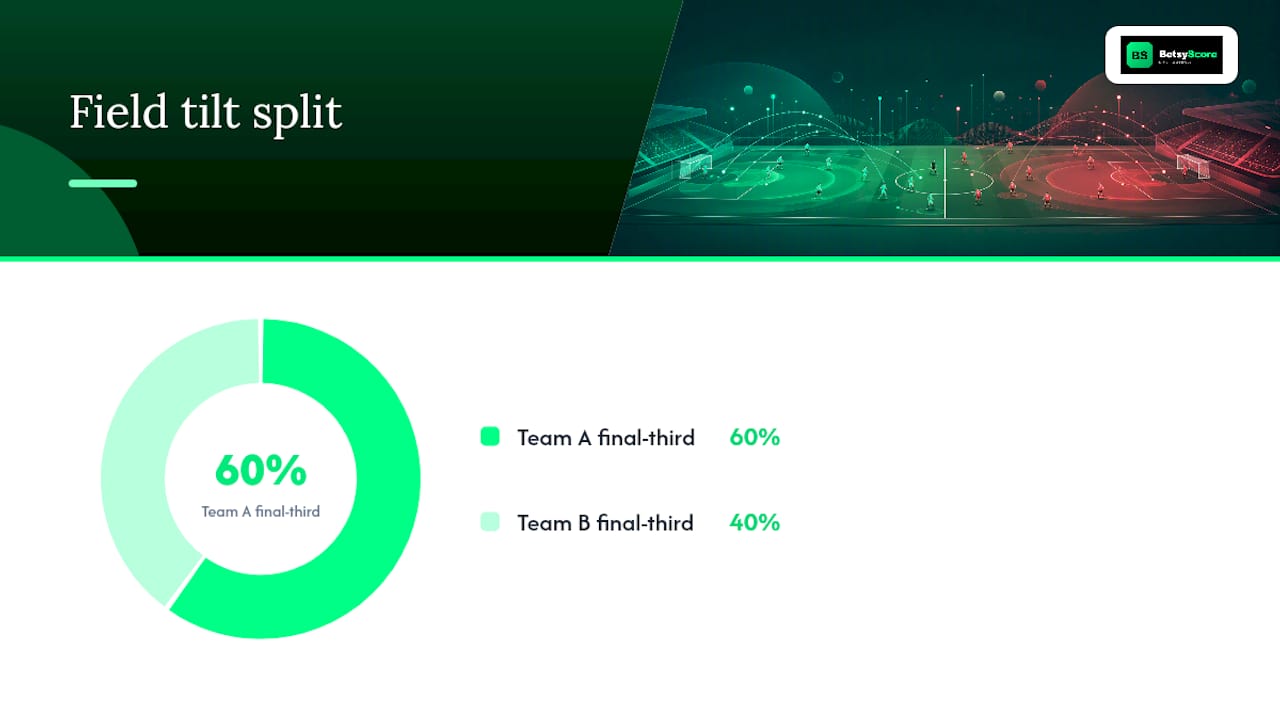
Here’s a simple case. Say Team A records many final-third passes and Team B records fewer. Add them together for a combined total. Divide Team A’s passes by the combined total, multiply by 100, and Team A finishes the match with a high field tilt percentage. That means six of every ten final-third actions belonged to Team A, even if the overall possession split read closer to 50/50.
How Analysts Track Tilt: Zones and Rolling Windows
Analysts don’t always agree on what counts as the “final third,” and that inconsistency matters more than most casual readers assume.
- Some providers use a strict geometric third of the pitch measured from the goal line.
- Others tighten the zone to the “attacking 20%” or widen it to include the halfway line, which shifts totals meaningfully between data sources.
- Full-match tilt gives a clean season-level number, but a 10 or 15-minute rolling average exposes when control actually shifted.
- Rolling windows smooth out one-off long clearances or goal-kick sequences that briefly spike a team’s raw count.
Event data for these calculations typically comes from tracked passes, touches, and receptions logged by professional data providers, the same feeds that power expected goals models.
Pro Tip: If you’re comparing tilt across two matches, always check whether both used the same final-third definition. A “tight zone” provider and a “loose zone” provider can disagree by 8 to 10 percentage points on an identical match.
Why Field Tilt Matters More Than Raw Possession
Possession counts who has the ball anywhere on the pitch, including a center back rolling passes across the back line. Field tilt only counts action where it threatens a goal, which is why the two numbers often tell contradictory stories.
- A team can hold a majority of possession while circulating the ball sterilely in its own half, producing a modest share of final-third action.
- A counterattacking side might sit at 40% possession yet register a higher tilt because every touch it takes comes closer to the opponent’s goal.
- Field tilt correlates more closely with shots and xG dominance than possession does, since it filters out the midfield passing that never threatens anything.
- Consistent tilt advantages across a season tend to flag genuinely front-footed teams, whereas high possession alone can just as easily describe a team that’s comfortable but toothless.
That divergence between the two metrics is where most of the useful insight actually lives, not in either number read alone.
Short Scenarios Where Tilt Tells a Different Story
- High possession, low tilt. A team holds 62% of the ball but spends most of it passing along its own back line. Field tilt sits near 45%, exposing the circulation as largely sterile.
- Low possession, high tilt. A team may have low overall possession but wins the ball back high and makes quick entries into the final third, resulting in a higher field tilt that captures efficiency the possession number misses.
- Scoreline-driven spike. A team chasing a 1-0 deficit throws numbers forward in the final 20 minutes, pushing full-match tilt upward even though the earlier balance of play was even.
Tactical Implications: How Coaches Use Field Tilt
Coaching staffs read tilt as a proxy for whether a game plan is working in real time.
- A rising tilt line during a match usually signals a press that’s pinning the opponent back and starving their build-up.
- Sustained tilt disadvantages can prompt earlier substitutions, a shift to a deeper block, or adjustments to rest defense (how many players stay back to guard against transitions).
- Analysts commonly present tilt as a rolling line chart layered against shot markers, letting coaching staff see pressure and output side by side.
Pro Tip: Watch for a team whose tilt climbs but whose shot map stays empty. That pattern often means the press is working territorially but the final ball isn’t there yet.
Building a Reliable Workflow: Pairing Tilt With xG and Game State
Field tilt on its own answers where the game was played, not whether that presence mattered. A dependable workflow adds context in layers:
- Pair tilt with xG or expected threat to judge whether territorial control produced real chances.
- Split tilt by game state, isolating spells where the score was level from spells where one team defended a lead, since scoreline effects distort full-match aggregates.
- Cross-check rolling tilt against shot maps and deep completions to confirm territory actually converted into penetration.
That three-step check turns a single number into a defensible read on a team’s attacking output.
Where Field Tilt Can Mislead You
Tilt is a territorial measure, not a quality measure, and treating it as the latter produces bad conclusions.
- Scoreline bias: a team protecting a one-goal lead often drops deep and cedes the final third on purpose, which drags full-match tilt down even though it played the smarter game.
- Sterile final-third activity: wide, low-danger circulation near the corner flag counts the same as a dangerous cutback, inflating tilt without adding threat.
- Direct or transition teams: sides built around quick counters can understate their danger on a tilt chart, since they spend fewer total seconds in the final third even when their few visits are lethal.
Combining tilt with deep completions or expected threat helps catch these cases before they get misread as pure dominance or pure weakness.
Seeing Field Tilt in Action on Betsyscore
Static tilt numbers tell you what happened after the fact. Betsyscore’s live match view puts a version of that same territorial read in motion while the game is still being played.
- The minute-by-minute momentum read tracks which side is asserting control in real time, functioning much like a rolling tilt chart without requiring a manual calculation.
- AI-powered win-probability percentages combine xG, recent form, and head-to-head data, giving territorial momentum a probabilistic frame rather than a raw share number.
- Live lineups, instant stats, and highlights across more than 200 competitions let readers cross-check a momentum swing against actual shots and events as they happen.
A momentum read combined with win-probability output provides live viewers with a dynamic territorial and quality analysis similar to methods analysts use manually with tilt and xG.
When I Reach for Field Tilt (and When I Don’t)
Field tilt is the fastest honest read on territory available in a match, and I lean on it whenever possession numbers seem to be lying about who controlled the game. For chance quality, I switch to threat-weighted metrics like xG or expected threat instead. Across a season, tilt trends matter more than any single-match reading, which bounces with game state and rarely tells the full story alone.
— Aria
Track Territorial Momentum Live on Betsyscore
Betsyscore turns the same territorial logic behind field tilt into something you can watch unfold in real time, without waiting for a post-match data export. The live match page tracks minute-by-minute momentum alongside instant stats and live lineups, so you can watch which side is pinning the other back before the final whistle settles the argument.

Pair that momentum read with the AI-powered predictions, which combine xG, recent form, and head-to-head data into a live win-probability line. That gives you a rolling read on territorial control and a probabilistic read on quality in the same view, covering everything from the Premier League to the FIFA World Cup 2026. Open a live match now and watch the momentum line move the next time a team starts to tilt the field.
FAQ
What Is Field Tilt in Soccer?
Field tilt is a team’s share of combined final-third passes or touches in a match, expressed as a percentage that reflects territorial dominance rather than overall ball control.
How Is Field Tilt Different From Possession?
Possession counts every touch anywhere on the pitch, while field tilt only counts action inside the attacking third, which is why a team can trail in possession but lead in tilt.
Why Should Field Tilt Be Paired With xG?
Field tilt shows where a game was played but not whether that territory produced dangerous chances, so pairing it with expected goals separates genuine threat from sterile final-third circulation.
Does a Losing Team Ever Have Higher Field Tilt?
Yes. A team chasing a goal late in a match often pushes numbers forward and racks up final-third touches, which can spike its tilt even while it’s losing on the scoreboard.
Can I See Territorial Momentum During a Live Match?
Betsyscore’s live match view shows a minute-by-minute momentum read alongside instant stats, giving a real-time sense of territorial control similar to a rolling field tilt chart.