Elo Ratings for Soccer Analysts: K=60–20, Top Teams & Live xG
Elo ratings in soccer are an adapted version of the chess rating system that scores every men’s national team on a single numeric scale based on match results, opponent strength, and margin of victory. Right now, the top of the World Football Elo Ratings table is dominated by the usual mix of South American and European powers, with teams like Argentina, France, and Spain occupying the highest tiers. The rest of this guide breaks down exactly how those numbers get calculated and what they mean for prediction.
TL;DR:
- Elo ratings for soccer are highly sensitive to major tournament results, with World Cup wins shifting ratings three times more than friendlies.
- Match importance determines the weight assigned to results, with World Cup games having the highest impact, while friendlies have minimal influence on ratings.
- Elo reacts primarily to results, not underlying performance factors, injuries, or tactical changes, which can lead to misleading short-term impressions.
- Combining Elo with real-time data like expected goals and momentum improves accuracy for predicting outcomes of ongoing matches.
Table of Contents
- Elo Ratings Soccer Rankings: Who’s on Top Right Now
- How Are Elo Ratings Calculated for Soccer?
- What Elo Points Actually Tell You
- Reading Points Exchanged: A Worked Example
- Elo vs FIFA World Rankings: What’s Different
- Combining Elo With xG and Live Momentum
- Historical Development and Origin of Elo Ratings in Soccer
- Elo Compared to Other Soccer Ranking Systems
- Where Elo Ratings Fall Short
- Tournament Matches vs Friendlies: Why the Weighting Changes
- Author Perspective and Practical Next Steps
- Get Live Match Probabilities Alongside Elo Data
- Sources
- FAQ
Elo Ratings Soccer Rankings: Who’s on Top Right Now
The World Football Elo Ratings table reshuffles after nearly every international match, but a small group of teams has held the upper tier for years. As of the most recent update cycle, the top of the table includes well-known football powers such as Argentina, France, Spain, England, Brazil, Portugal, Belgium, Netherlands, Germany, and Italy.
Exact point totals shift constantly, so treat this as a snapshot rather than a fixed list. Major tournaments cause the biggest movement. A deep run at a World Cup or continental championship can shift a team several places, while a group-stage exit against weaker competition can quietly bleed points over two or three matches. Friendlies barely move the needle by comparison.
For live, up-to-the-minute tables, dedicated ranking sites publish match-by-match logs showing points gained or lost after each result. When you see a “+14” or “−9” next to a team name, that’s the points exchanged from a single match. Betsyscore’s live match pages track those same results as they happen, which is useful for cross-referencing a rating shift against the actual game that caused it.
How Are Elo Ratings Calculated for Soccer?
The football-specific Elo formula is a direct descendant of the chess version, adjusted for the realities of the pitch. The standard equation is:
Rn = Ro + K × (W − We)
Here’s what each term means:
- Rn is the team’s new rating after the match.
- Ro is the team’s rating going into the match.
- K is the weight assigned based on how important the match is.
- W is the actual result: 1 for a win, 0.5 for a draw, and 0 for a loss. A match decided by penalties is often scored as a draw for World Football Elo purposes, though FIFA’s own system treats penalty shoot-out winners as outright winners.
- We is the expected result, calculated from the rating gap between the two teams (often written as dr) with an adjustment added for home advantage.
The K value is where match context enters the picture. According to the Elo rating system for football, typical weights vary by importance: World Cup matches have the highest weight, followed by continental championship matches, qualifiers, major tournaments, secondary tournaments, and friendlies which have the lowest weighting.
That means a World Cup win swings three times more rating points than the identical result in a friendly. Goal difference matters too. Practitioners commonly apply a small multiplier so a 3–0 win exchanges noticeably more points than a 1–0 win, without scaling linearly with every extra goal. This keeps a 6–0 rout from distorting the table the way a naive linear formula would.
Home advantage gets folded into We rather than treated as a separate bonus. Historical club-level data modeled by Betfair’s data scientists estimates the effect of home advantage in Elo points to be significant, varying by competition and era, and it is added to the home team’s rating before the expected result is calculated. On the international stage, that number varies by competition and era, but the principle holds: playing at home shifts the expected outcome before a single kick.
What Elo Points Actually Tell You
A rating gap of 120 points translates to roughly a 66.6% win expectation for the favored side, according to the standard Elo win-probability curve used across the World Football Elo Ratings system. Bigger gaps push that number higher, but soccer’s low-scoring nature means even heavy favorites lose more often than an equivalent favorite in basketball or American football.
Ratings need time to settle. It generally takes many official matches before a team’s Elo rating reliably reflects its true competitive strength. Newly promoted federations or teams returning from long suspensions often carry provisional ratings that can fluctuate until sufficient match data is available. Multiple studies cited in the Elo literature find these ratings hold up well for match prediction compared with several alternative systems, but caveats apply:
- Elo reacts only to results, not underlying performance quality, so a team riding lucky bounces can look stronger than it is for a stretch.
- It says nothing about injuries, suspensions, or squad changes between matches.
- It’s a single number, not a distribution, so it can’t tell you how volatile a matchup is likely to be.
Pro Tip: Don’t treat a single Elo number as a betting signal on its own. Cross-reference it against recent expected-goals data and current form before drawing conclusions about an upcoming match.
Reading Points Exchanged: A Worked Example
When a ranking feed shows a match result, the number next to each team is the points exchanged, positive for the winner and negative for the loser. A worked example makes this concrete.
Statistic Callout: Say a team rated 1900 beats a 1700 team 2–0 in a qualifier (K = 40). The rating gap gives the underdog a relatively low win expectation, so the favorite’s actual result exceeds that expectation considerably. The goal-difference adjustment for a 2–0 win increases the points exchanged, resulting in a moderate gain in rating points.
Run the identical scoreline as a friendly instead, and the K drops to 20. The exchange shrinks to roughly six or seven points, same match, same margin, half the rating impact simply because of the competition tier.
Elo vs FIFA World Rankings: What’s Different
FIFA moved to an Elo-inspired method in 2018, but it isn’t the same calculation as the independent World Football Elo Ratings. Three differences stand out:
- FIFA’s formula excludes goal differential entirely, so a 1–0 win and a 5–0 win earn identical points.
- FIFA counts penalty shoot-out results as a full win or loss, while many Elo implementations score them as a draw.
- The two systems use different sensitivity settings, which means Elo often reacts more sharply to a lopsided scoreline than FIFA does.
The practical consequence: Elo tends to show bigger swings after decisive results, while FIFA’s table moves more conservatively. Analysts leaning toward match prediction or contextual strength assessment tend to favor Elo for that reason, while FIFA’s ranking still governs tournament seeding and qualification paths.
Combining Elo With xG and Live Momentum
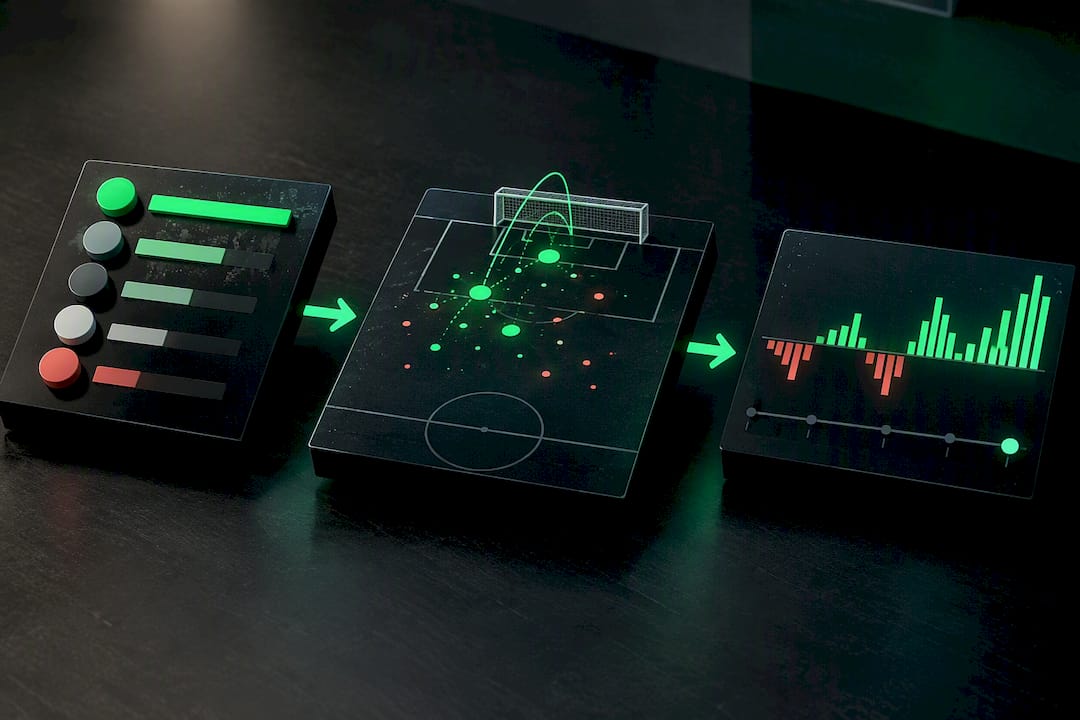
Elo works best as a long-run baseline, not a live forecast. It tells you which team is structurally stronger over years of results, but it says nothing about who controlled the last ten minutes of play. That’s where expected-goals data and short-term form should override a pure Elo read, especially for a single upcoming fixture.
Modelers commonly build ensembles that start with an Elo prior and adjust it using recent xG and form signals, a combination that improves match-by-match accuracy. Minute-by-minute momentum tracking, the kind Betsyscore reports during live matches, captures the in-game shifts Elo simply cannot see.
Historical Development and Origin of Elo Ratings in Soccer
The Elo rating system started as Arpad Elo’s tool for ranking chess players, adopted officially by the World Chess Federation in the 1970s. Its logic was simple and portable: a player’s rating rises or falls based on results against opponents, weighted by how surprising each result was relative to expectation.
Soccer analysts and hobbyist statisticians began adapting that same logic to international football well before any governing body took formal notice. The appeal was obvious. Chess and soccer both involve two competitors whose relative strength can be expressed as a single number, and both benefit from a system that rewards beating a stronger opponent more than beating a weaker one.
The independent World Football Elo Ratings project extended the base chess formula with adjustments specific to the sport: a weighting scheme tied to match importance, an adjustment for goal difference, and a home-field advantage term. None of those elements exist in the original chess version, since chess has no concept of margin of victory or home advantage in the same sense.
That grassroots, statistically-driven approach ran for years as a fan and analyst resource, gaining a reputation for solid predictive performance well before FIFA introduced its own Elo-influenced ranking overhaul in 2018. The two systems now run in parallel, each with its own following, but the independent Elo model retains the loyalty of analysts who value its sensitivity to score margins and match context.
Elo Compared to Other Soccer Ranking Systems
Elo isn’t the only statistical framework used to rank national teams. Two other approaches show up regularly in analytics circles: Glicko and composite power indices like SPI-style models.
Glicko, developed as a refinement of Elo for chess, adds a “rating reliability” component that Elo lacks in its basic form. Instead of just a single number, Glicko tracks how confident the system is in that number, which shrinks over time as a team plays more matches and grows when a team has gone quiet for a stretch. Soccer analysts have experimented with Glicko variants, but the base Elo formula remains far more widely published and easier for casual fans to track.
Composite power-index systems, the kind popularized by outlets that blend expected goals, market data, and player-level metrics into a single power score, take a fundamentally different approach. Rather than updating purely from win/loss/draw results like Elo, these models ingest shot quality, squad depth, and sometimes betting-market signals directly. That makes them more responsive to underlying performance trends, but also more complex, more opaque, and more dependent on data quality that varies by league and country.
Elo’s advantage over both alternatives is transparency. Anyone can recompute a team’s rating by hand given the match history and the K weights. That simplicity is exactly why Elo has stayed the reference point for so many independent analysts, even as fancier models compete for attention.
Where Elo Ratings Fall Short
Elo rewards results, not performance quality, which creates a real blind spot. A team that wins 1–0 off a single deflected shot gains the same rating boost as a team that dominates 1–0 from start to finish. Over enough matches this evens out, but in the short term it can flatter a lucky side.
The system also can’t account for information outside the scoreline. A key striker’s injury, a manager’s dismissal, or a squad rotation ahead of a dead-rubber group match none of that registers until it shows up in results weeks later. Elo is backward-looking by design, which makes it a poor tool for reacting to breaking news.
Provisional ratings are another weak spot. A federation with fewer than 30 official matches on record, common for smaller or newly independent nations, carries a rating that hasn’t yet converged, according to the World Football Elo Ratings methodology. Treating that number as equivalent to a well-established team’s rating is a common mistake among casual users of the data.
Finally, Elo has no concept of squad depth, tactical matchups, or head-to-head history beyond what’s already baked into past results. Two teams with identical ratings can have wildly different styles that produce very different outcomes against a specific opponent, something a single number simply cannot capture.
Tournament Matches vs Friendlies: Why the Weighting Changes
The K weight is Elo’s built-in acknowledgment that not all matches carry equal stakes. A World Cup final and a midseason friendly both count as 90 minutes of soccer, but they don’t reflect a team’s true strength with the same reliability, so the formula treats them differently.
World Cup matches use the heaviest weight at K = 60, reflecting both the quality of competition and the fact that teams generally field their strongest available squads. Continental championship matches sit just below at K = 50. Qualifiers and other major tournament fixtures use K = 40, while smaller regional tournaments drop to K = 30. Friendlies, often played with squad rotation, experimental lineups, or reduced motivation, carry the lightest weight at K = 20.
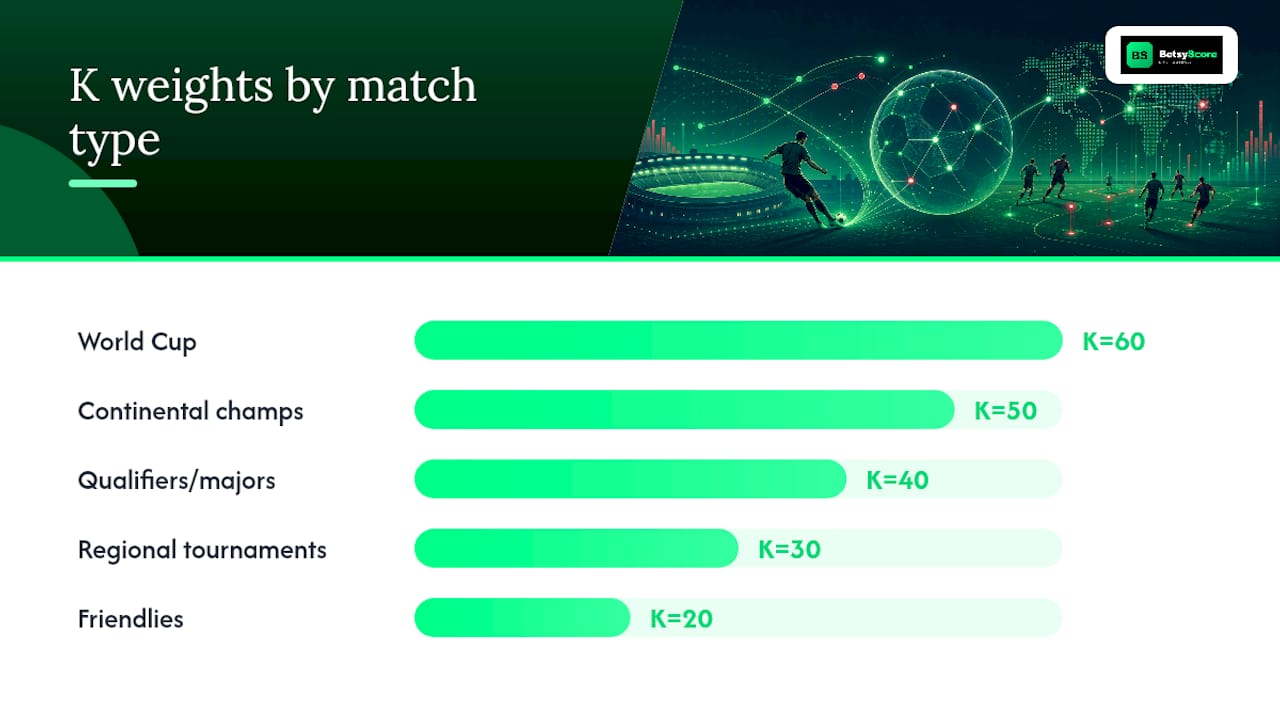
This tiered approach solves a real problem: a friendly loss to a limited squad shouldn’t crater a team’s rating the way a competitive qualifier loss should. It also means fans checking a ranking feed after a friendly should expect smaller point swings even for a decisive result, while a World Cup upset can reshuffle the table dramatically overnight.
Author Perspective and Practical Next Steps
Use Elo as your long-run compass, not your live scoreboard. Recheck the full table after every major tournament window, since that’s when the biggest point swings happen. Pair the historical Elo baseline with real-time momentum and probability reads for the sharpest possible read on any single match.
— Aria
Get Live Match Probabilities Alongside Elo Data
Elo tells you which team is structurally stronger over years of results. It won’t tell you who’s controlling the ball right now, in the 63rd minute, with a card already shown and a substitution about to change everything. That’s the gap Betsyscore fills. The platform delivers live scores that refresh every few seconds, AI-generated win probabilities built from expected goals, recent form, and head-to-head data, plus a minute-by-minute momentum read that shows which side is dictating play as the match unfolds.

Pair a team’s long-term Elo standing with Betsyscore’s real-time AI predictions before kickoff, then track the live match page once play begins to see how the probability shifts as the game develops. Check live scores to see momentum and win-probability updates for current fixtures.
Sources
For the full technical breakdown of the formula and match-importance weights, see the Elo rating system for football entry on Wikipedia. For rankings history, predictive performance notes, and the home-advantage research behind the We calculation, the World Football Elo Ratings page and Betfair’s soccer modeling analysis both offer deeper detail.
FAQ
What Is a Good Elo Rating in Soccer?
The top of the World Football Elo Ratings table is dominated by well-known football powers, with teams like Argentina, France, and Spain occupying the highest tiers. Context matters more than the raw number, since ratings shift constantly after every official match.
How Often Do Elo Ratings Update?
Ratings update after every official international match a team plays, which means friendlies, qualifiers, and tournament games all trigger a recalculation. Major tournaments like the World Cup produce the largest shifts because of their higher K weight and concentrated match schedule.
Why Do Elo and FIFA Rankings Disagree?
Elo and FIFA diverge because FIFA excludes goal differential and scores penalty shoot-outs as outright wins or losses, while independent Elo calculations weigh margin of victory and often treat shoot-outs as draws. The two systems also use different sensitivity settings, so Elo tends to swing harder after lopsided results.
Can I Use Elo Ratings to Predict Matches?
Elo gives you a solid long-run baseline for match prediction, and studies cited in the Elo methodology point to strong predictive performance relative to several alternative systems. For single-match forecasts, pairing that baseline with live data such as Betsyscore’s AI predictions accounts for current form and momentum that Elo alone can’t capture.
Why Do New National Teams Have Unstable Ratings?
A team’s Elo rating needs roughly 30 official matches before it converges toward an accurate reflection of true strength. Teams with fewer matches on record, often newer federations, carry provisional ratings that can swing sharply with each additional result.