Turn Post Shot xG Into Action for Analysts Using a 10 Shot Rule
Post-shot xG measures the probability that an on-target shot becomes a goal, based on where the ball crosses the goal line rather than where it was struck from. That single distinction separates it from standard xG, which only accounts for the situation before the shot leaves the player’s foot. PSxG, also called xGOT, gives analysts a finishing signal and coaches a cleaner benchmark for judging goalkeepers.
TL;DR:
- Post-shot xG only applies to shots on target and depends on shot end-location data, making it unreliable with small sample sizes or missing coordinates.
- Gradient-boosted models tend to calibrate PSxG more accurately, but improper calibration can lead to biased season-long goalkeeper metrics.
- Large and consistent gaps between PSxG and pre-shot xG over multiple matches are more meaningful than single-game deviations, which are often noise.
- Rebounds and deflections complicate PSxG calculations, requiring separate analysis to avoid overestimating shot quality or goalkeeper performance.
- Analysts should treat PSxG as a prioritization tool for video review, not a definitive judgment, waiting for patterns to develop across several matches.
Table of Contents
- Post-Shot xG vs Pre-Shot xG: Getting the Terms Straight
- How Analysts Calculate Post-Shot xG
- Why Post-Shot xG Matters for Finishing and Goalkeeping
- Reading the Numbers: Two Worked Examples
- Where Post-Shot xG Breaks Down
- Building Post-Shot xG Into Your Analysis Workflow
- The Honest Limits of Post-Shot xG
- See Post-Shot xG in Action on BetsyScore
- Sources
- FAQ
Post-Shot xG vs Pre-Shot xG: Getting the Terms Straight
Pre-shot xG assigns a scoring probability the instant a shot is taken, using distance, angle, defensive pressure, and assist type. It never sees the outcome. Post-shot xG picks up where pre-shot xG stops, recalculating that probability once the ball’s actual end-location in the goalmouth is known. A weak shot straight at the keeper and a rocket into the top corner might carry identical pre-shot xG, but wildly different PSxG.
Providers use several labels for the same concept: xGOT (expected goals on target), PSxG, and “post-shot xG” all describe the identical calculation. Opta/StatsPerform’s xGOT model builds directly on pre-shot xG by layering in shot end-location and trajectory data.
One detail trips up newcomers constantly: PSxG only applies to shots on target. A blocked effort or one sailing over the bar has no PSxG value, because there is no end-location inside the frame to measure. This conditional sample matters when you compare players. A striker with fewer shots on target has a smaller PSxG pool to draw conclusions from.
How Analysts Calculate Post-Shot xG
A PSxG model needs the shot’s end coordinates in the goalmouth, expressed as x, y, and sometimes z (height off the ground). Where available, models also fold in shot speed, body part used, and whether a deflection altered the ball’s path after contact. Rebounds get handled separately, since a second effort off a loose ball carries a different risk profile than the original attempt.
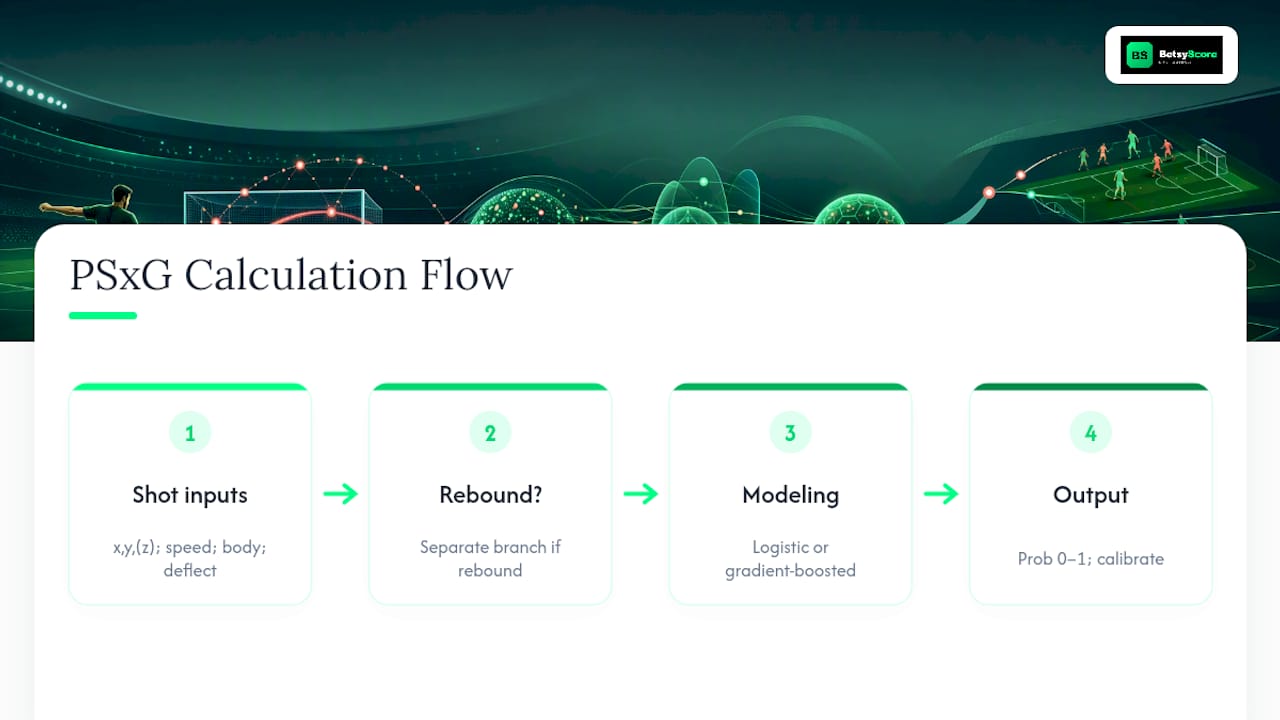
Most public and provider models lean on logistic regression or gradient-boosted trees to turn those inputs into a probability between 0 and 1. Gradient-boosted methods tend to handle the nonlinear relationship between placement and scoring odds better than a simple regression, particularly near the corners of the goal where small location shifts swing the probability sharply.
Calibration is where models succeed or fail. A model is calibrated when shots it rates at 0.30 actually go in roughly 30 percent of the time across a large sample. StatsBomb’s PSxG research notes that gradient-boosted models restricted to on-target shots need deliberate calibration checks, since narrowing the sample shifts the underlying probability distribution. Get calibration wrong, and every season-long goalkeeper metric built on top of it inherits that bias.
Why Post-Shot xG Matters for Finishing and Goalkeeping
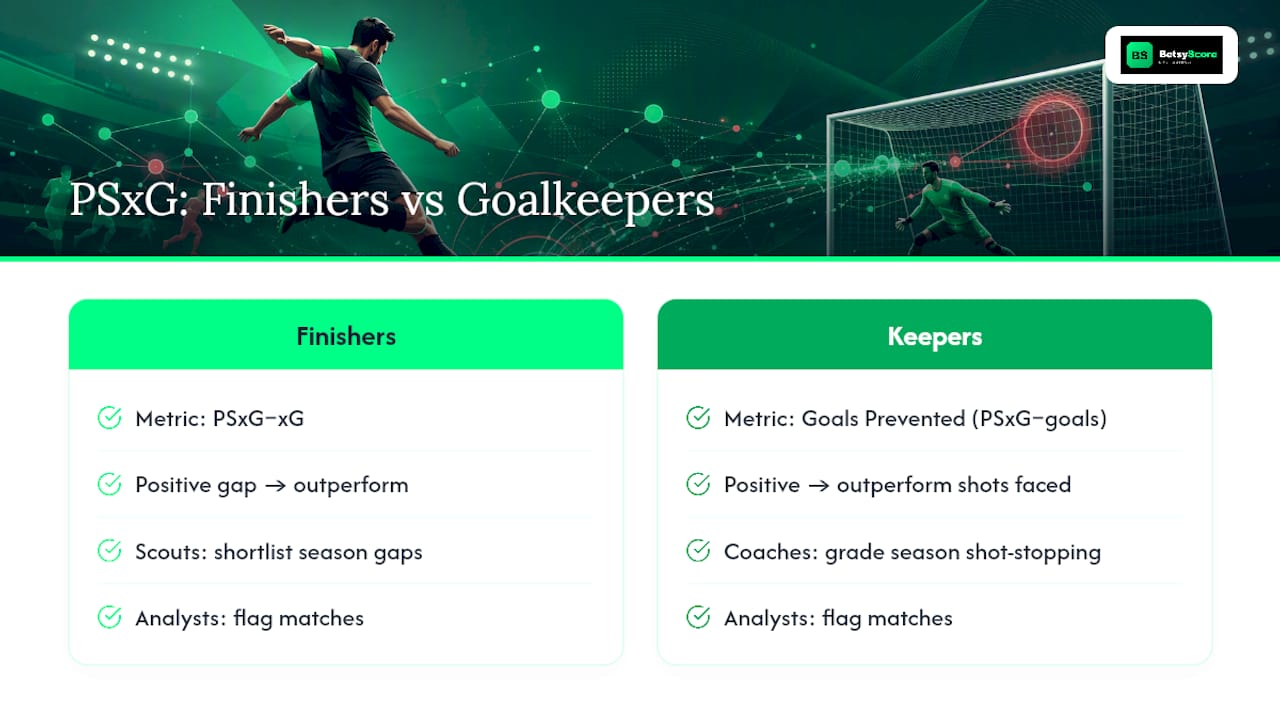
When a player’s cumulative PSxG exceeds their pre-shot xG on the same shots, that gap points to finishing quality above what the situation alone predicted. One inflated match means little. A gap that holds up across a season, though, is a real signal worth acting on.
The same logic flips for goalkeepers. Goals Prevented is calculated as total PSxG faced minus goals actually conceded. A keeper facing 8.0 PSxG worth of shots who concedes fewer goals than that number is outperforming the shots they saw. SoccerAnalytics’ explainer on goalkeeper metrics makes the case plainly: pre-shot xG underestimates the true difficulty of shots that actually reach the frame, which is exactly why PSxG gives a fairer keeper benchmark.
In practice, scouts use xGOT-minus-xG gaps to shortlist finishers worth a closer look, coaches use Goals Prevented to grade shot-stopping across a season, and video analysts use both to flag matches that deserve a second viewing, rather than a quick glance at the scoreline.
Reading the Numbers: Two Worked Examples
A 30-yard speculative strike carrying 0.03 pre-shot xG that curls into the top corner might register 0.45 PSxG once you account for where it actually finished. That gap, 0.03 to 0.45, is not noise. Repeated across a handful of shots from the same player, it starts to look like a genuine hit on placement and technique rather than luck.
A keeper facing a substantial PSxG across shots on target and conceding fewer goals than that number posts a positive Goals Prevented figure. That is a solid return, but ten shots is a thin sample. Treat it as an early read, not a verdict.
When presenting PSxG in a report, include a few things every time:
- The raw PSxG and goals figures side by side, never just the derived total.
- The number of shots on target the figure is built from.
- A plain note on confidence: fewer than ten shots deserves a caveat, not a headline.
Where Post-Shot xG Breaks Down
PSxG is a strong tool with real blind spots. Small samples swing wildly. A keeper’s Goals Prevented can look outstanding or dreadful after five shots and settle into something ordinary by matchday twenty, so single-match or even single-month conclusions are a trap.
Rebounds complicate attribution further. A parried shot that leads to a second effort splits the danger between two events, and models that lump them together overstate or understate a keeper’s actual performance. Deflections are just as messy: a shot that changes direction off a defender midflight can register a PSxG value that has nothing to do with the goalkeeper’s positioning. The StatsBomb research recommends separating primary shots, rebounds, and deflected attempts into distinct categories rather than training one blended model.
Public datasets frequently lack shot-end coordinates or shot-speed data entirely, which weakens any PSxG approximation built on top of them. Add a miscalibrated model to that gap, and season-level keeper rankings can end up systematically skewed in one direction.
Building Post-Shot xG Into Your Analysis Workflow
The most useful habit an analyst can build is treating a large xGOT-minus-xG gap as a trigger, not a conclusion. Flag it, then go watch the footage.
A workable routine looks like this:
- Flag shots or matches where PSxG diverges sharply from pre-shot xG.
- Pull the video and check defender positioning and keeper setup before the shot.
- Cross-reference shots on target against total shot volume to see whether the divergence reflects real quality or a small, noisy sample.
- Log the finding and revisit it after the player’s or keeper’s next several matches.
Shot-end heat maps, an xG-versus-xGOT scatter plot, and a keeper’s PSxG-faced timeline across a season are the three visualizations that turn raw numbers into something a coaching staff will actually use. BetsyScore’s breakdown of goalkeeper PSxG modeling walks through how that kind of model gets built and applied against live match data.
Pro Tip: Never draw a firm conclusion on Goals Prevented or a finishing gap from fewer than ten on-target shots. Wait for a multi-match window before you let the number change your opinion of a player.
The Honest Limits of Post-Shot xG
PSxG is a triage tool, not a verdict. It tells you where to point a video review, not what conclusion to reach before watching. A single wild deviation is usually noise. What deserves your attention is a gap that holds up match after match, shot after shot.
Use it to prioritize your limited scouting hours, document what you find on video, and let the pattern, not one number, do the convincing.
— Aria
See Post-Shot xG in Action on BetsyScore
The math in this article turns into something you can watch unfold in real time on some platforms, without waiting for a postmatch data dump. Some platforms carry live shot data feeding into win-probability and momentum reads, showing PSxG-style inputs that separate a keeper’s good luck from good positioning.

Start on the live match pages to watch shot quality and momentum shift in real time as a game unfolds. From there, check the AI predictions page to see how expected-goals inputs feed into win-probability calls before kickoff. If you are tracking a specific keeper’s season, browse the player profile pages for the underlying shot-stopping numbers behind the headline stats.
Sources
For deeper technical grounding, see StatsPerform’s xGOT methodology, StatsBomb’s original PSxG research, and The Football Analyst’s piece on player evaluation.
- Enhancing Expected Goals on Target: Deeper Insights Into Shot Execution, Goalkeeper Performance, and a Dedicated Model for Women’s Football — StatsPerform
- A New Way to Measure Keepers’ Shot Stopping: Post-Shot Expected Goals • StatsBomb Blog Archive
- Post-Shot xG and Goalkeeper Metrics: How We Measure Shot-Stopping — SoccerAnalytics
FAQ
What Is Post-Shot xG?
Post-shot xG, or xGOT, is the probability that an on-target shot becomes a goal, calculated using the ball’s actual end-location and trajectory rather than just the pre-shot situation.
Why Is xG Flawed?
Pre-shot xG only accounts for the situation before a player strikes the ball, so it can’t distinguish a weak effort straight at the keeper from a rocket into the corner. That’s the exact gap post-shot xG is built to close.
What Does 0.05 xG Mean?
A shot with 0.03 pre-shot xG is an example of a low-quality chance before it’s even struck, based on characteristics like distance, angle, and defensive pressure.
Is a Higher xG Always Better?
Not necessarily. A single high-xG shot that misses says little about a player’s ability, while a modest xG total built from smart positioning and quality opportunities over many matches is usually more meaningful than one big number.