MLS Predictions: How to Read Win Probabilities in 2026

MLS predictions are probability estimates for a single match or a whole season. A model takes inputs such as expected goals, recent form, travel and rest, then turns them into win, draw and loss percentages or a most likely scoreline. Treat the output as a measured lean, not a verdict. MLS is among the harder top leagues to forecast, and the playoffs, played as single games, are harder still.
This guide explains what an MLS forecast measures, which inputs matter in this league, how accuracy has held up, and how to use a percentage sensibly before kickoff.
TL;DR
- An MLS prediction estimates probabilities for one match. Supporters’ Shield, playoff and MLS Cup forecasts are separate targets with separate logic.
- MLS-specific factors such as long travel, turf, rest days, roster changes and a hard salary cap shape the numbers more than in most leagues.
- Even a leading sportsbook line picked about 52% of MLS games correctly across 2012 to 2021, so no source should be read as certain.
- A 60% forecast still leaves a large chance of a draw or a loss. Read percentages as frequencies over many similar matches.
- Different sources disagree because they weight inputs differently. Compare the reasoning, not only the headline number.
Table of Contents
- What an MLS prediction actually forecasts
- Which factors drive MLS match forecasts
- How models turn inputs into percentages
- Why MLS is harder to predict than most leagues
- How accurate are MLS predictions?
- How to read a win probability
- Why two sources give different numbers
- A practical matchday routine
- Follow predictions and live data on BetsyScore
- Our perspective
- FAQ
- Sources
What an MLS prediction actually forecasts
The phrase covers several different products, and mixing them up is the most common reading error.
A match prediction gives the probability of a home win, a draw and an away win for one fixture. Many models add a projected scoreline, a both-teams-to-score estimate or an over/under goals line. These are the numbers most readers look up on a matchday.
A season prediction estimates where a team finishes in its conference, who wins the Supporters’ Shield and who reaches the playoffs. This is a cumulative result of 34 matches per club, so one bad weekend moves it little.
A playoff or MLS Cup prediction estimates each team’s chance of reaching each round and winning the title. An MLS analytics group that publishes playoff projections models each team’s probability of reaching each stage and winning the championship. The same group notes that the playoffs are volatile, so even the tournament favorite may not be heavily favored.
The distinction matters because the Supporters’ Shield rewards the regular season, while MLS Cup is decided through knockout rounds. A team can be the best across 34 matches and still have a modest title probability, because single-elimination games compress the gap between strong and average sides.
Which factors drive MLS match forecasts
Most serious models start with the same core: how many good chances a team creates and concedes, and how that has trended lately. In MLS, several league-specific factors are added on top.
An open-source MLS modeling project documents the features it uses. They include expected goals for and against, weighted over the last 5 and 10 games, away-team travel distance, rest days, playing surface, recent form, the playoff-position race, Designated Player availability and conference matchup.
Here is why each one matters in practice:
| Factor | What it captures | Why it matters in MLS |
|---|---|---|
| Expected goals (xG) and xG against | Quality of chances created and allowed | Less noisy than goals over short stretches |
| Recent form (5 and 10 match windows) | Current level versus season average | Rosters change during the year |
| Travel distance | Miles covered by the away side | Coast-to-coast trips are routine |
| Rest days | Recovery between fixtures | Congested schedules during cup and international windows |
| Playing surface | Grass versus turf | Some venues use turf, which can change play |
| Designated Player availability | Whether the star signings are fit | A single absence can shift a team’s output |
| Conference matchup and playoff race | Incentives late in the season | Teams already qualified or eliminated play differently |
Home advantage deserves its own mention. A 2023 machine learning study of English Premier League, La Liga and MLS matches built a random forest on 91 features and reached 86.31% classification accuracy on the combined dataset. The same study found that home field advantage in MLS is about two times more important than in La Liga and the Premier League. That is a useful reminder that a home side’s baseline is higher in MLS than a European-trained intuition suggests.
Note what that accuracy figure means. It describes a research setup with a combined dataset, not a promise that any weekly forecast will land at that rate.
How models turn inputs into percentages
The typical pipeline has three steps.
- Estimate team strength. Attack and defense ratings are built from expected goals, shots and results, weighted toward recent matches.
- Convert strength into expected goals for this fixture. Home advantage, travel and rest adjust the expected goals for each side.
- Simulate or calculate outcomes. The model turns expected goals into a distribution of scorelines, then sums them into win, draw and loss probabilities.
The published playoff model from the MLS analytics group above shows the third step clearly. It predicts expected goals from team-level metrics, including goals added produced this season, last season and in the most recent 10 games, then uses Poisson distributions to assign a probability to each side scoring 0, 1, 2, 3 or more goals. Multiply those distributions together and you get the chance of each scoreline, and from there each result.
This is also where a predicted score comes from. The “predicted score” shown on most pages is simply the single most likely scoreline, such as 2-1. It usually has a probability of only 10% to 15%, so a different scoreline will often happen even when the forecast result is right. For a deeper walkthrough of the build, see our practitioner’s guide to football match prediction algorithms, and for analysts who want to score their own models, our piece on building win probability models.
Why MLS is harder to predict than most leagues
MLS has structural features that compress differences between teams.
A hard salary cap. The open-source documentation describes MLS as the only top-flight soccer league in the world with a hard salary cap. It argues this produces real competitive parity and more frequent upsets than in Europe, so models leaning on squad value or wage spend as features tend to underperform. In European leagues, payroll is a strong predictor. In MLS it is a weaker one.
Travel and conditions. Away teams can fly across several time zones, and some venues play on turf. These are measurable, which is why good models include them.

Roster volatility. Transfers, loans and international call-ups change a squad during the season. Models that rely on historical data can lag behind a new coach, a new signing or a tactical change. A reputable source may therefore be slow to reflect them, a point raised in a 2026 discussion of machine learning forecasts.
Playoff format. Single-elimination rounds add variance on top of an already balanced league.
There are also gaps no model fully closes. The 2020 playoff model from the analytics group mentioned above did not account for strength of schedule or explicitly for whether teams were at full strength. Its authors noted that LAFC played more than 75% of their minutes without Carlos Vela, so a team rating built on the whole season can misdescribe the squad that actually takes the field in the playoffs.
How accurate are MLS predictions?
Accuracy depends on what you measure, but the published numbers agree on one thing: MLS is difficult.
- A 2022 analysis of MLS predictability found that a leading sportsbook’s line correctly predicted 52.2% of all MLS games from 2012 to 2021, ranging from 55.1% in 2018 to 49.2% in 2021. In the same comparison, Serie A was at 56.1% and Liga MX at 47.4%.
- A 2026 betting-strategy article reports that the same kind of market line calls Premier League outcomes at around 60% but MLS outcomes at roughly 47%, a gap of about 13 points. The two sources use different samples and periods, which explains why 47% and 52.2% differ.
Take the range, not a single figure: roughly half of MLS results are called correctly by the sharpest market lines. A three-outcome sport, where draws occur regularly, makes high hit rates difficult by design. Picking the most likely result in a balanced league will often be wrong.
A better test than “how often was the favorite right” is calibration. If a model says 60% across many matches, those teams should win about 60% of the time. Scoring rules such as the Brier score measure this, and they reward honest probabilities over bold calls.
How to read a win probability

A percentage describes repeated, comparable situations. When a model says a team has a 62% chance, it means that outcome would occur about 62 times in 100 similar matches. In the other 38 the result goes another way. The same logic applies to a modeling view that even a 60% forecast leaves substantial residual probability for a draw or defeat.
Here is a worked example with illustrative numbers, not a real fixture:
| Outcome | Probability | Plain reading |
|---|---|---|
| Home win | 48% | About one in two |
| Draw | 27% | More than one in four |
| Away win | 25% | One in four |
The home side is favored, yet the home side does not win in more than half of comparable matches. That is a normal MLS forecast, and it is why a draw is rarely a surprise.
Four habits help:
- Read all three numbers. The draw probability is often higher than readers expect.
- Compare the favorite’s margin. A 40% to 33% gap is a slight lean. A 65% to 12% gap is a strong one.
- Check expected goals, not only the result. Two teams with equal win odds can have very different attacking profiles, which tells you about both-teams-to-score and total goals.
- Look at the lineup. A forecast made before team news is incomplete. Confirmed lineups and the absence of a key Designated Player can move the numbers.
Why two sources give different numbers
Two credible MLS forecasts for the same game can differ by several points. This is expected. Sources weight inputs differently and can disagree on match or title odds: one gives more weight to the last five matches, another to the full season, another adds travel and a third ignores it. Update timing matters too. A forecast published two days before kickoff may not include a late injury.
When you compare sources, ask four questions:
- Does it use expected goals or only results?
- How recent is the data window?
- Is it updated after lineups are announced?
- Does it show the full outcome distribution, or only a pick?
If two sources agree on the direction and differ on the size, the match is probably a modest favorite. If they disagree on direction, the match is close, and the honest reading is that the model has little edge. We cover the same comparison for another league in our look at how the main Bundesliga prediction sources compare, and the common reading mistakes in Champions League prediction errors to avoid apply equally to MLS.
A practical matchday routine
Use a prediction as one input in your own preview.
- Start with the probabilities. Note the favorite, the margin and the draw chance.
- Check the context. Look at rest days, the length of the away trip and the surface.
- Confirm the lineups. Check whether the main attackers and Designated Players are starting.
- Watch the match. Live momentum shows which side is creating chances minute by minute, so you can see whether the pre-match read is holding.
- Review afterward. Compare expected goals with the scoreline. A team that won 1-0 on 0.4 xG was fortunate, and its next forecast should not be inflated by the result alone.
For playoff games, widen your uncertainty. Single-elimination rounds and rosters that may not be at full strength mean that even a clear favorite carries real risk of going out.
Follow predictions and live data on BetsyScore
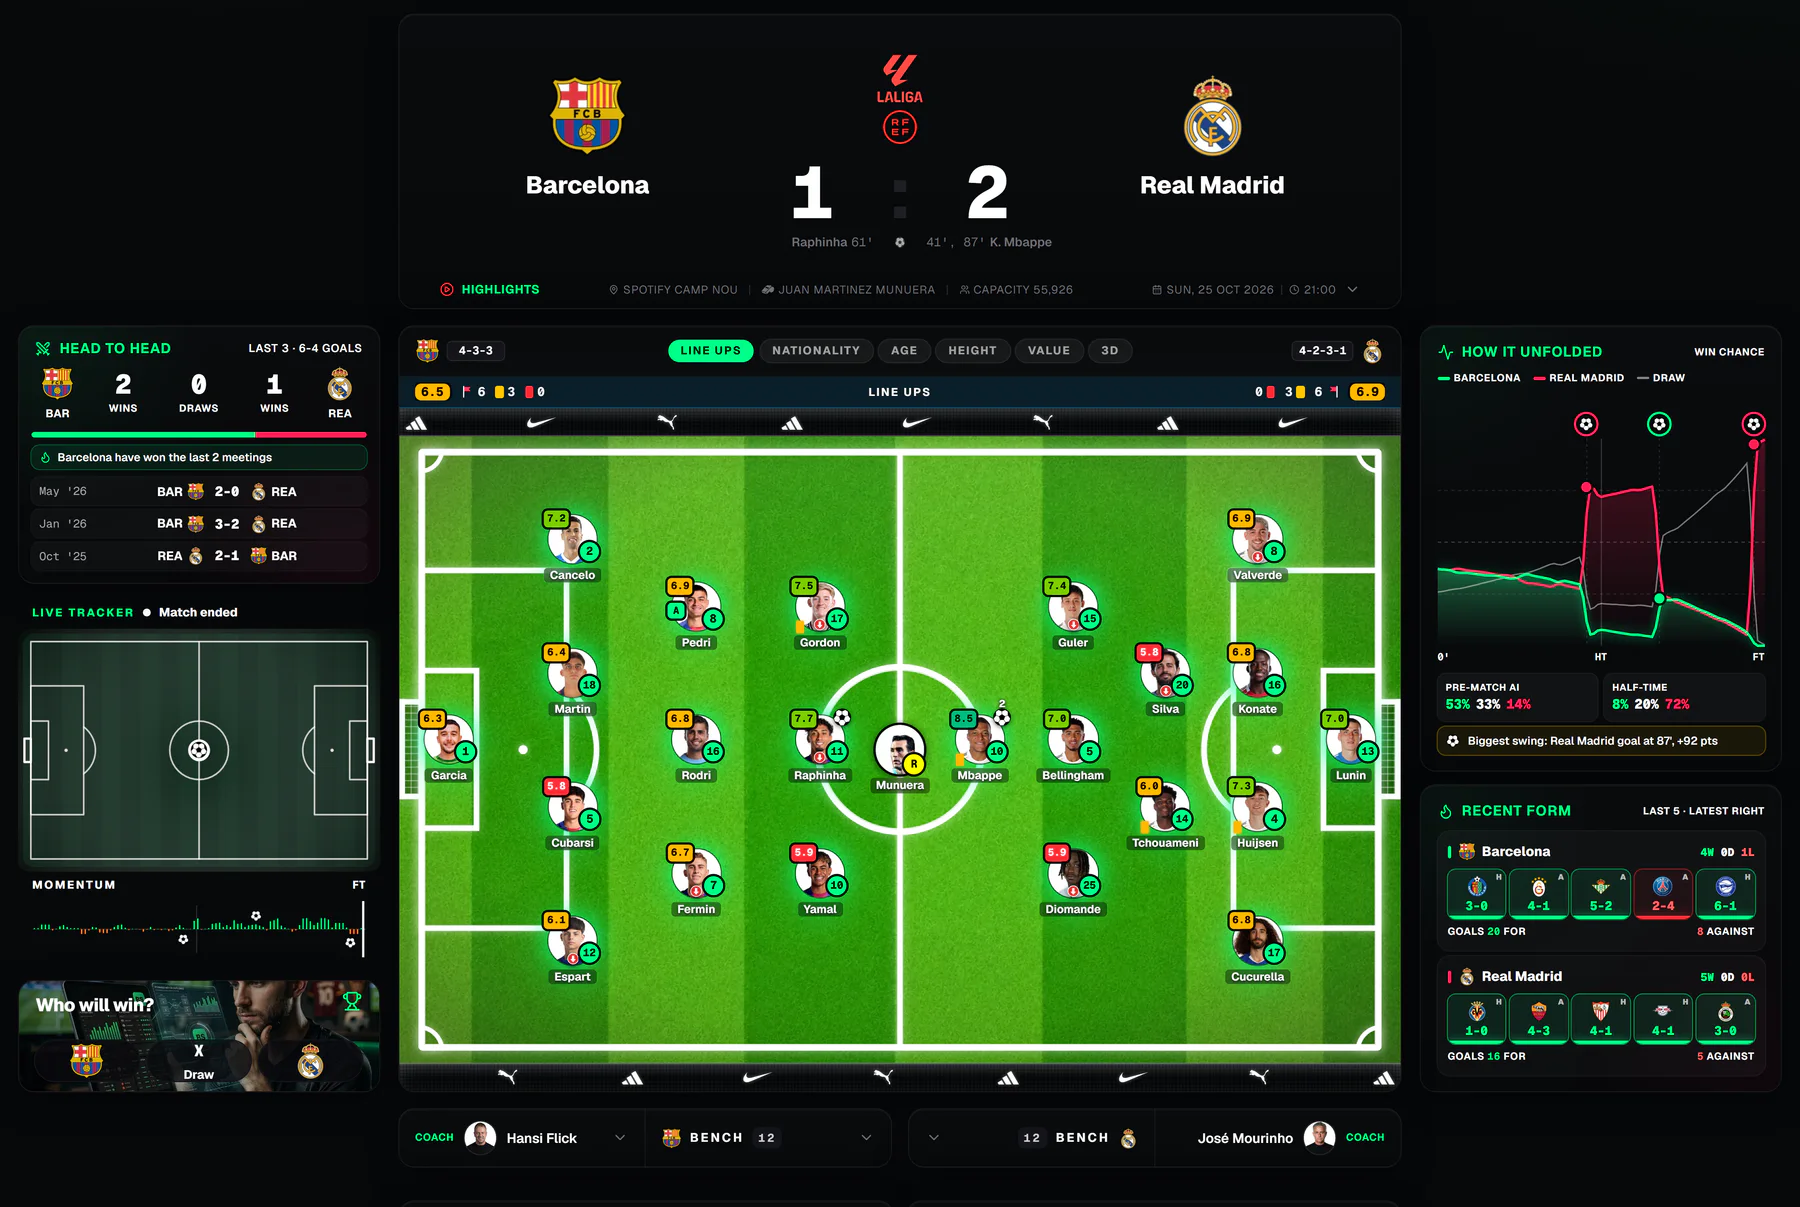
BetsyScore combines live scores that refresh every few seconds with AI-powered win probabilities built from expected goals, recent form and head-to-head records, plus a minute-by-minute momentum read. Our platform covers more than 200 competitions worldwide, with live lineups, player profiles and match highlights alongside the forecasts.
Open the AI predictions page to see win probabilities and lineups for upcoming matches, browse predicted scorelines for every match today, or follow games as they happen on the live scores page.
Our perspective
Prediction pages tend to fail in one of two ways. They either hide the method behind a confident pick, or they publish a single number with no sense of its spread. We think a forecast is useful only when you can see what sits behind it.
That is why we show win probability alongside the inputs a fan can verify: expected goals, recent form and head-to-head records. A percentage is easier to trust when you can check whether the team really has been creating better chances, and our momentum view lets you test the pre-match read against what is happening on the pitch minute by minute.
MLS rewards this approach. Parity, travel and roster change mean that results routinely depart from reputation, and a clean, fast, data-first view lets you see those departures as they develop. We built BetsyScore to be useful before, during and after every match: a forecast beforehand, live context during play, and the numbers to review afterward.
Aria
FAQ
Are MLS predictions reliable?
They are reliable as probability estimates, not as guaranteed results. Even a leading sportsbook line picked about 52% of MLS games correctly between 2012 and 2021. Judge a source by how well its percentages match outcomes over many games, not by single hits.
What is the difference between an MLS match prediction and an MLS Cup prediction?
A match prediction gives win, draw and loss probabilities for one fixture. An MLS Cup prediction estimates each team’s chance of advancing through every playoff round to the title. The playoff version is more volatile because of single-elimination rounds, so even the favorite’s title probability is often modest.
Why do different sites show different predictions for the same MLS game?
Models weight inputs differently, use different data windows and update at different times. Some include travel, rest and Designated Player availability, and others do not. A source that updates after lineups are announced will often differ from one published days earlier.
What does a 60% win probability mean?
It means that, across many similar matches, the team would be expected to win about 60 out of 100 times. In the other 40, it draws or loses. A draw is a real possibility in a three-outcome sport, so a 60% favorite not winning is a normal result, not a model failure.
Which stats matter most for predicting MLS games?
Expected goals for and against over recent matches, home advantage, travel distance, rest days and the availability of key players are the most commonly used inputs. Because MLS has a hard salary cap, wage spend and squad value are weaker predictors than in European leagues, according to an open-source MLS modeling project.
Sources
- Explaining our 2020 MLS playoffs projections
- MLS predictions modeling documentation
- What does it take to win or lose a soccer game? A machine learning study
- How Predictable is Major League Soccer?
- MLS Betting Strategies: How to Bet on MLS
- Using Machine Learning Models for Soccer Betting Predictions