Bundesliga Predictions: How the Main Sources Compare

The best Bundesliga predictions come from a data model that shows its inputs and its probabilities, and that you can check against bookmaker-implied odds. Tipster picks and crowd forecasts are useful context, but published research on the Bundesliga found that betting odds and prediction markets both beat professional tipsters. This guide compares the five kinds of Bundesliga prediction fans use, explains what each one forecasts, and shows how to judge reliability without being misled by short winning streaks.
TL;DR
- Five source types dominate: AI and statistical models, bookmaker odds, prediction markets, individual tipsters and crowdsourced boards. Each answers a different question.
- A study of German matches found odds and prediction markets equally accurate, and both ahead of tipsters.
- Profit is not the same as accuracy. Positive returns can occur without a better model, so judge a source by calibration over many matches.
- Match result, both teams to score (BTTS) and over/under 2.5 goals are separate predictions. Check that a source states which one it is making.
- BetsyScore publishes win-probability percentages built from expected goals, recent form and head-to-head records for every Bundesliga fixture.
Table of Contents
- What a Bundesliga prediction actually predicts
- The five types of Bundesliga prediction source
- Comparison table
- How to judge whether predictions are reliable
- Using predictions with live scores and lineups
- How predicted results move the table
- Perspective
- Where to find Bundesliga predictions on BetsyScore
- Try the data-first approach
- Which source to use for which question
- FAQ
- Sources
What a Bundesliga prediction actually predicts
Before comparing sources, separate the formats. Fans use several, and a source that is strong in one can be weak or silent in another.
Match result (1X2). The forecast is a home win, a draw or an away win. A good model expresses it as three probabilities that add up to 100%, not as a single pick. A 55% home win with a 25% draw and a 20% away win is more informative than the words “home win”.
Predicted scoreline. A single score such as 2-1 is the most likely individual result, not the most likely outcome. Because many different scores share the same result, the most probable exact score usually carries a low probability on its own. Treat it as an illustration of the expected game shape.
Both teams to score. BTTS is a two-way market. BTTS Yes requires both teams to score at least once, while BTTS No means one or both teams fail to score. A 1-0 and a 0-0 are both BTTS No.
Over/under 2.5 goals. This forecasts total goals, not the winner. Over 2.5 means three or more goals in total, and Under 2.5 means two or fewer. A 2-0 is Under 2.5 and BTTS No. A 2-1 is Over 2.5 and BTTS Yes. The two markets overlap but do not match, which is why a 3-0 win is Over 2.5 and still BTTS No.

Table and season predictions. Here, each predicted result is turned into points and the standings are recalculated. Interactive table predictors work this way: you enter scores for a matchday and see the resulting table. They are good for exploring scenarios such as the title race or relegation, but they depend entirely on the quality of the match inputs.
The five types of Bundesliga prediction source
AI and statistical models
These systems convert match data into probabilities. The most common building block is expected goals (xG), a measure of shot quality. xG is built from shot-level features such as location, angle and assist type, and a model then converts recent xG into win-draw-loss probabilities, in the cited study with a Skellam distribution.
The strength of this approach is consistency. The same inputs always produce the same output, there is no mood or favorite club involved, and the probabilities can be tested over hundreds of matches. The limitation is that a model only knows what it has been given. Late injuries, rotation after a European fixture and tactical changes enter only once the data reflects them, which is why live lineups matter.
A 2026 study by Sascha Wilkens covering 11 Bundesliga seasons (2014/15 to 2024/25) found that bookmaker odds were generally better calibrated per category, but a simple xG model kept competitive overall discrimination power. In plain terms, a transparent xG-based approach is a credible way to rank matches by likely outcome, even if the market is hard to beat on calibration.
Bookmaker odds
Odds are the market’s price for each outcome and are widely regarded as a strong benchmark. They are not raw probabilities, though. Bookmaker prices carry a margin, and turning odds into probabilities means scaling them to add up to 1, which removes the margin only approximately. If you compare a model with odds, convert them this way and treat the result as an estimate.
Odds are useful as a reference point even for readers who never place a wager. If a model gives a side 60% and the market-implied figure is 45%, that gap is a reason to look at lineups and form before trusting either number.
Prediction markets
Prediction markets aggregate the views of many participants who stake money on outcomes. In the German study cited above, prediction markets and betting odds performed equally well on accuracy. They are less widely available to fans than odds, and liquidity on a single Bundesliga match can be thin, so they work best as a cross-check.
Individual tipsters and video channels
Tipster columns, blog posts and video channels offer a personal read, often with a pick for every matchday. They are quick to digest and can include useful team news. The weakness is measurable: the same research found tipsters trailing both odds and prediction markets in the Bundesliga. A tipster who explains a reasoning chain, such as pressing structure against a high defensive line, is more useful than one who posts only a scoreline.
Crowdsourced boards
Community boards collect hundreds of picks by category (1X2, BTTS, totals) and often track a profit record. They show what fans think, and they can surface niche markets. The issue is that popularity is not accuracy, and a profit figure alone does not tell you whether a forecaster is good. The next section explains why.
Comparison table
| Source type | What it gives you | Strength | Watch for |
|---|---|---|---|
| AI / statistical model | Probabilities for result, goals, BTTS | Consistent, testable, transparent inputs | Late team news not yet in the data |
| Bookmaker odds | Priced outcomes | Strong market benchmark | Built-in margin; not true probabilities |
| Prediction market | Crowd-priced outcomes | Accuracy on par with odds in the German study | Thin liquidity on single matches |
| Individual tipster | A pick plus reasoning | Context and team news | Trailed odds and markets in research |
| Crowdsourced board | Many picks by category | Wide range of markets | Popularity and profit are not accuracy |
How to judge whether predictions are reliable
Accuracy is not profit
A streak of winning picks feels like proof, but it is weak evidence. Wunderlich and Memmert argued that betting returns should not be treated as a valid measure of model accuracy, because positive returns can arise by chance or through betting behavior without a better model. Profit also depends on prices. The earlier German study reported that none of the forecasts produced systematic gains once the 25% fees of the state-owned bookmaker were included.
That does not mean profitable approaches never exist. The Wilkens study reported a simulated return on investment of about 10% with average market odds and nearly 15% with the best available prices for its xG-based model. It is a backtest on historical data, not a promise, and it shows why the quality of the model and the price you accept are separate questions.

Check calibration
A calibrated forecaster is right about 70% of the time when it says 70%. To test this, group predictions into bands and compare predicted with observed rates. This needs volume: with a few hundred matches per band, a small gap between predicted and observed percentages could be a few points of noise. A Bundesliga season has 306 matches, so a single season is barely enough to say anything about each band.
A practical checklist
- Does the source name its inputs? Expected goals, recent form and head-to-head records are checkable. “Gut feeling” is not.
- Does it give probabilities, not just picks? Percentages let you see how confident the forecast is.
- Is the sample large enough? Be skeptical of any track record built on a few dozen picks.
- Is the record about accuracy or profit? Only accuracy and calibration measure the forecast itself.
- Does it update? Lineups and in-match events change the picture. Quality in live models depends on event ordering, latency, state reconciliation and replay testing.
- Can you combine it with another view? Spann and Skiera noted that combined forecasts often improve accuracy, particularly with rule-based combinations.
Using predictions with live scores and lineups
A pre-match probability is a starting point. Once the teams are announced, it is worth rereading it: a missing striker or a rotated defense can move a match. After kickoff, the score and the flow of play change the odds quickly. A red card, an early goal or a spell of sustained pressure alters what is likely in the remaining minutes.
This is where a live platform adds value over a static article. Our live scores page refreshes every few seconds, and each match page combines the prediction with lineups and stats. Our momentum read shows which side is on top minute by minute, so you can see whether a scoreline reflects the game or flatters one team.
How predicted results move the table
One match prediction is a small input, but season outcomes come from adding up many of them. Three points for a win and one for a draw means a draw-heavy forecast keeps the table compressed, while confident home wins in the top fixtures widen the gap. A table predictor makes this visible: enter your scorelines for a matchday and watch the standings change.
Two habits keep this honest. First, do not enter only the most likely score for every match, because that rule produces too few draws and too many narrow wins compared with a real season. Second, treat the output as a scenario, not a forecast. For fixtures involving the top sides, such as Bayern München vs Borussia Dortmund or Bayer Leverkusen vs RB Leipzig, the probability split is often the most informative part, because it shows how close the contest is.
Perspective
We built BetsyScore around one idea: a prediction is only useful if you can see what it is made of. Every Bundesliga forecast on the platform is a set of win-probability percentages built from expected goals, recent form and head-to-head records, so a reader can ask why a side is favored and see the data behind the answer.
The research on German football points in the same direction. Markets and models have outperformed individual opinion, and no single hot streak proves a method. That is why we present probabilities rather than guarantees, and why we pair them with live lineups and minute-by-minute momentum. A pre-match number is the opening view of a match, not the final one.
For fans, analysts, bloggers and journalists, the aim is the same: a fast, clean place where the numbers are in front of you before, during and after every match. We designed the platform to be that place.
Aria
Where to find Bundesliga predictions on BetsyScore
Our Bundesliga predictions page lists the upcoming matchday with predicted scores and win probabilities. For a deeper look at one game, open its match page: Bayer Leverkusen vs VfB Stuttgart, RB Leipzig vs Eintracht Frankfurt and Borussia Dortmund vs Werder Bremen are typical examples, each combining the forecast with expected lineups.
For other leagues and the World Cup, the AI predictions hub covers more than 200 competitions, and the daily predicted scorelines page gathers every match of the day in one list.
Try the data-first approach
If you want Bundesliga predictions that show their reasoning, start with the forecast for your next match, check the lineups when they are announced, and follow the momentum during play. Everything is free to use on BetsyScore.
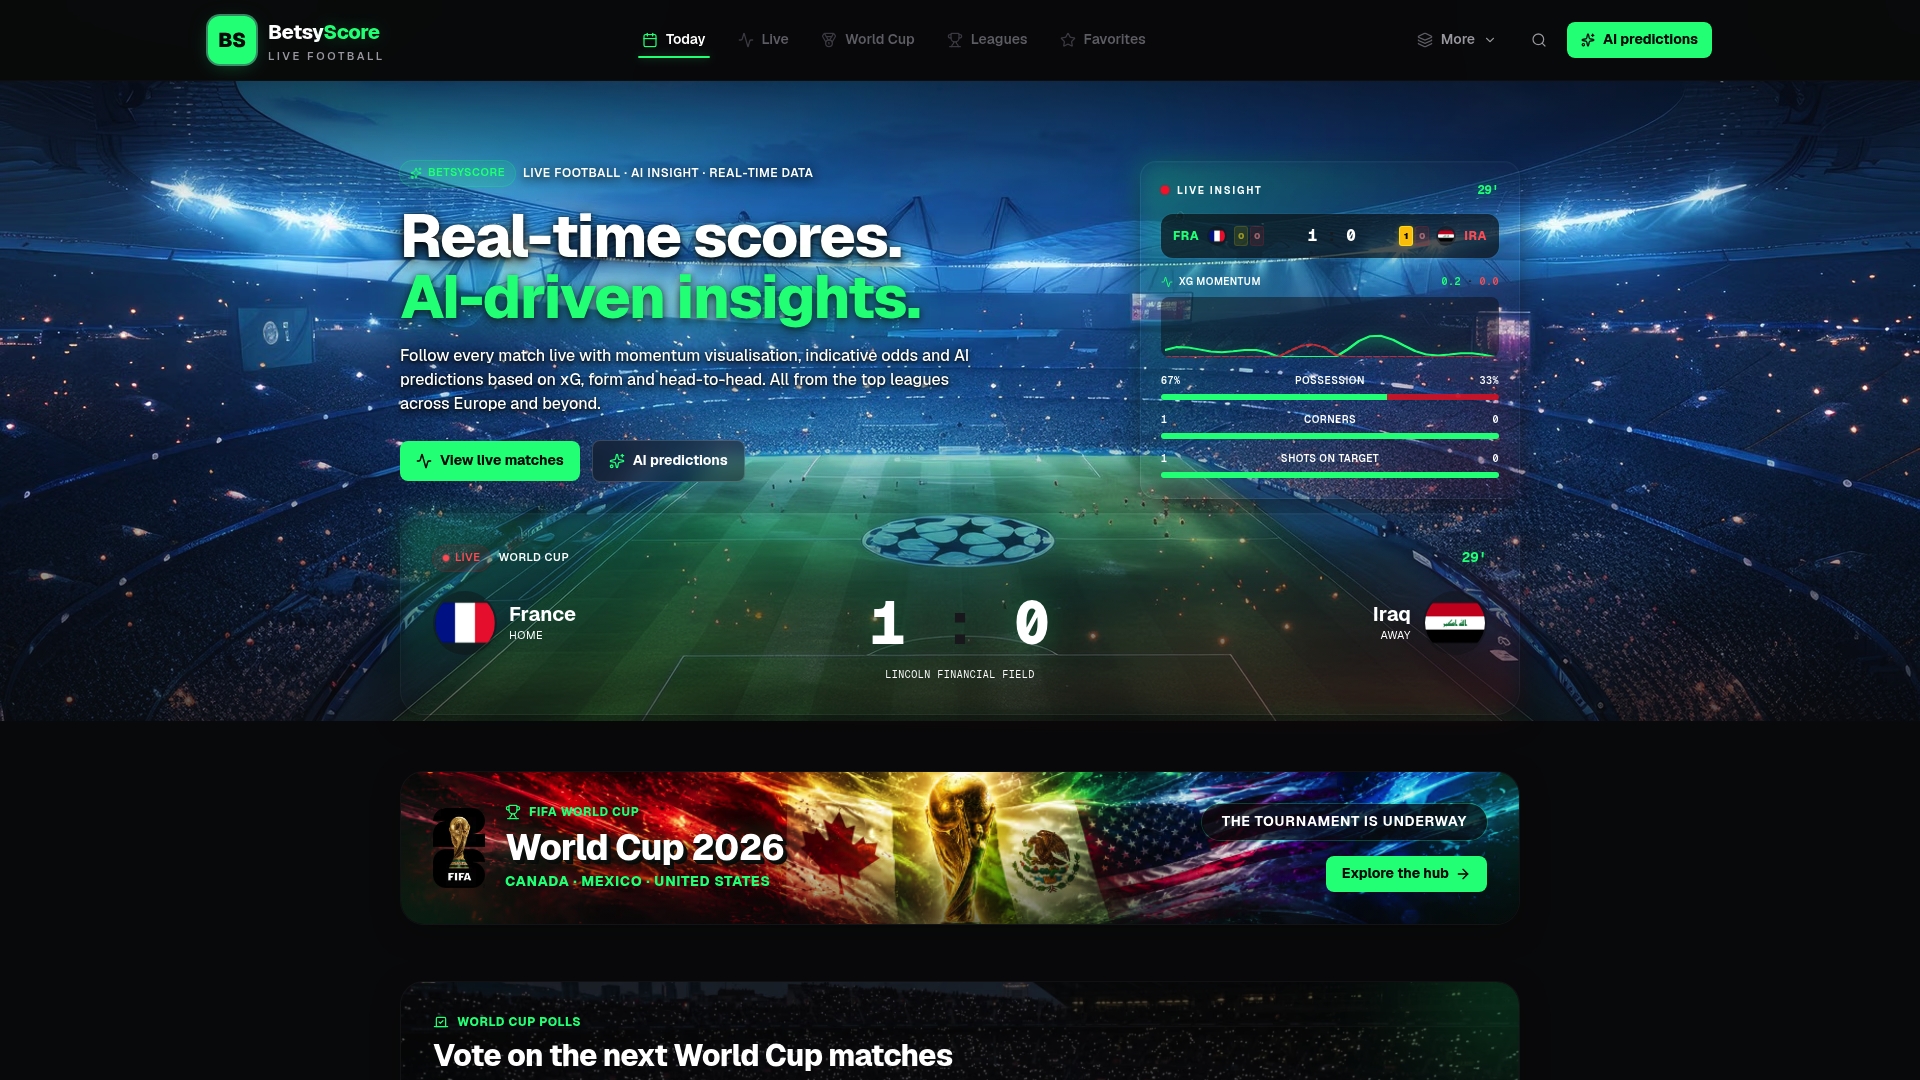
BetsyScore is built for fans who want the numbers behind the match, whether you follow one club or track the whole league.
Which source to use for which question
- “Who is more likely to win?” Start with model probabilities, then compare with market-implied odds.
- “Will both teams score?” Use a source that states a BTTS probability and look at each team’s recent xG for and against.
- “Is this a high-scoring match?” Check the over/under 2.5 probability and the expected total goals, not the predicted winner.
- “How might the table look?” Use a table predictor with realistic inputs, including draws.
- “What changed since the forecast?” Use live scores, lineups and momentum.
FAQ
Are Bundesliga predictions accurate?
Accuracy varies by method. In a study of German matches, betting odds and prediction markets were equally accurate and both outperformed tipsters. No source predicts every result, and football’s low scoring makes upsets common, so judge forecasts by probabilities over many matches.
What is the difference between BTTS and over/under 2.5 goals?
BTTS asks whether both teams score at least once. Over/under 2.5 asks whether the total reaches three goals. A 3-0 win is Over 2.5 but BTTS No, and a 1-1 draw is BTTS Yes but Under 2.5.
Can expected goals predict Bundesliga results?
Expected goals are a strong input. The Wilkens study found that a simple xG model retained competitive discrimination power across 11 Bundesliga seasons, although bookmaker odds were better calibrated per category. Models work best when combined with lineup and form information.
Does a profitable record prove a prediction source is good?
No. Positive returns can occur by chance or through betting behavior without a superior model. Look at calibration and sample size instead of profit alone.
Sources
- Sports forecasting: a comparison of the forecast accuracy of prediction markets, betting odds and tipsters
- Can simple models predict football, and beat the odds?
- Are betting returns a useful measure of accuracy in sports forecasting?
- Is accuracy the right score? Evaluating a model
- Soccer Betting Markets Explained
- Live AI Football Predictions Explained
- Sports forecasting (Spann and Skiera)