How World Cup Live Stats Work: A Fan's Guide
World Cup live stats are defined as real-time data outputs generated by combining human event-coding analysts and multi-camera optical tracking systems installed inside stadiums. Understanding how world cup live stats work means recognizing that every pass, shot, and sprint you see quantified on screen comes from two parallel data streams running simultaneously. Trained analysts log every on-pitch event live while optical cameras capture player and ball positions frame by frame. These streams merge, get processed through high-speed data pipelines, and reach your screen within seconds. The result is a live statistical picture that goes far beyond the scoreline.
How do World Cup live stats work at the collection stage?
Live football stats begin with two distinct data types: event data and positional data. Event data comes from human analysts who watch the match and manually code every action, including passes, tackles, fouls, and shots, as they happen. Positional data comes from optical tracking cameras mounted around the stadium, recording player and ball coordinates continuously.
Optical tracking systems capture skeletal and positional data at frequencies between 25Hz and 50Hz. That means the system records each player’s location up to 50 times per second. BBC Sport’s 3D World Cup viewer, for example, uses 16 optical tracking cameras running at 50Hz to generate skeletal player data for live match playback directly in a browser using Unity WebGL technology.
The industry standard governing this data is the Electronic Performance and Tracking Systems (EPTS) format, mandated by IFAB in 2015. EPTS standardizes how positional data is structured and shared across broadcasters, platforms, and analytics providers. Without this standard, each vendor would produce incompatible data formats, making cross-platform delivery nearly impossible.
- Event data: Human analysts code discrete actions such as passes, shots, cards, and substitutions in real time.
- Positional data: Optical cameras track every player and the ball continuously, producing spatial coordinates at high frequency.
- EPTS standard: Ensures all positional data is formatted consistently for downstream use.
- Dual-stream fusion: Combining human coding with optical tracking is the current state of the art, providing both event accuracy and precise spatial context.
Pro Tip: When you see a heatmap or sprint distance figure during a live broadcast, that number comes from the optical tracking stream, not from a human analyst counting manually.
How is live match data processed and delivered to fans?
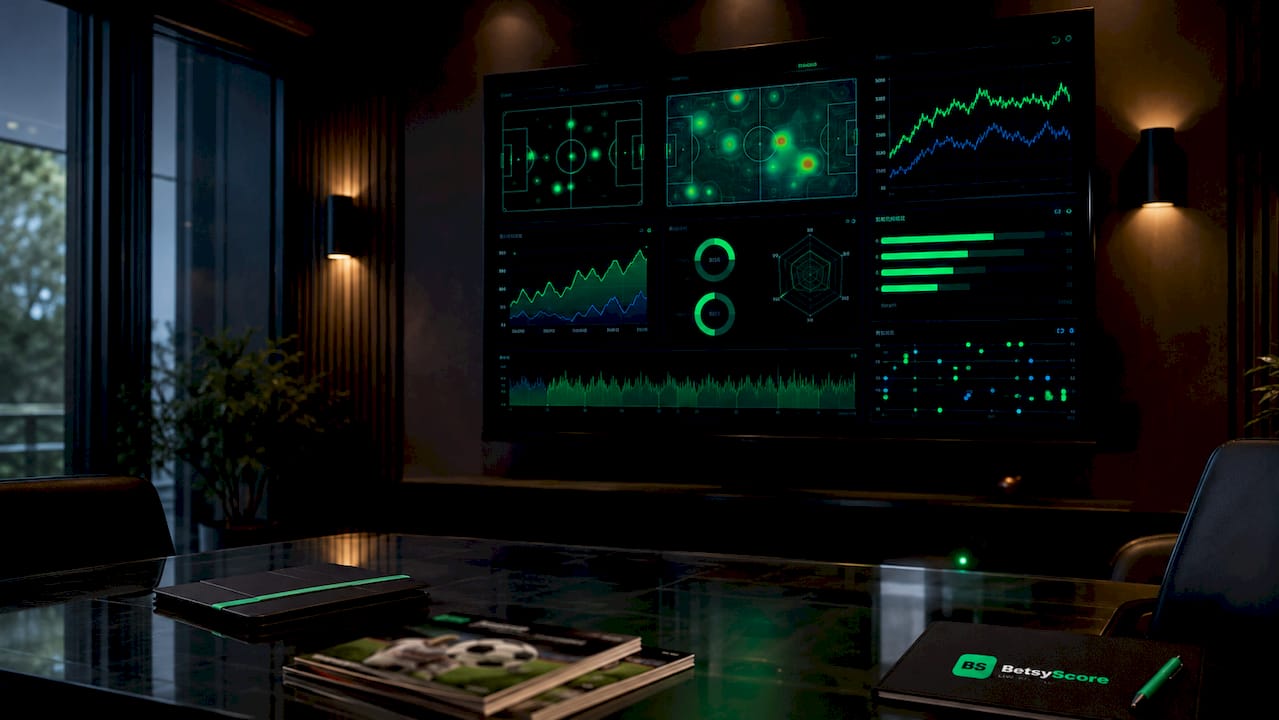
Raw data collected at the stadium does not travel directly to your screen. It passes through a structured pipeline that processes, verifies, and distributes it at scale.
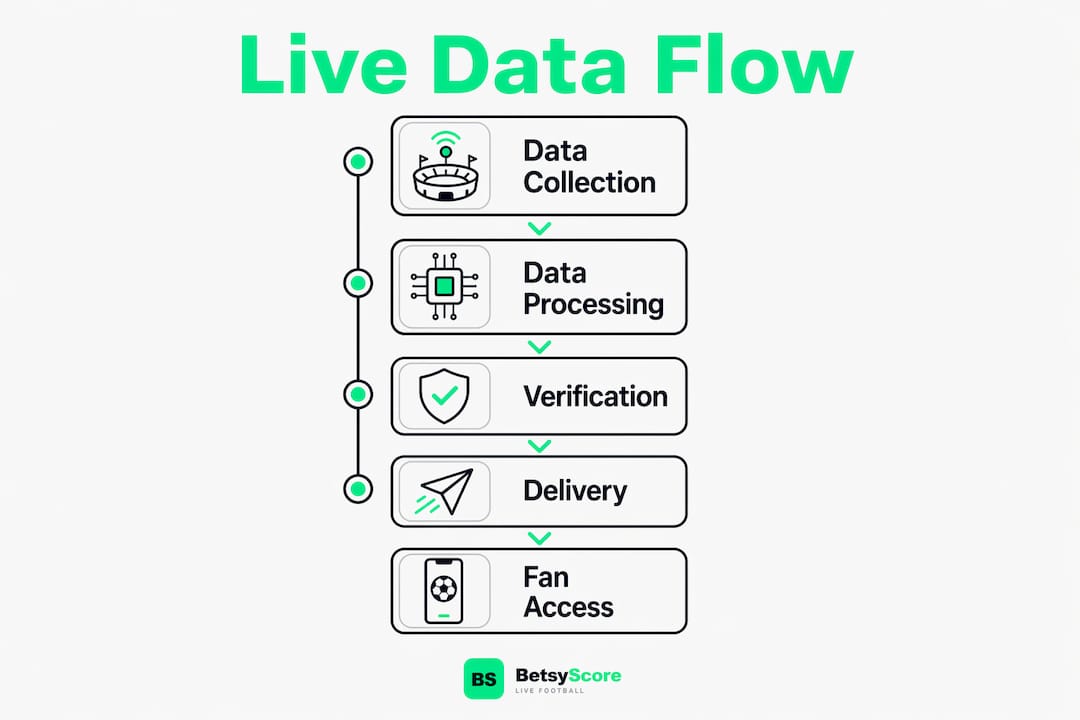
The pipeline works in stages. Analysts confirm events, optical feeds supply coordinates, and both streams feed into a central processing layer. From there, RESTful API endpoints distribute synchronized match state data including goals, lineups, and advanced stats to broadcasters and applications worldwide.
- Data ingestion: Analyst-coded events and optical tracking feeds enter the processing layer simultaneously.
- State synchronization: A central system reconciles both streams and builds a unified match state.
- API distribution: RESTful endpoints serve updated match data to downstream clients on set polling intervals.
- In-memory caching: Redis hot-data stores with sub-millisecond query times hold the current match state for rapid retrieval.
- Edge delivery: CDN edge caching distributes data to servers close to end users, reducing geographic latency.
The choice of delivery protocol matters. REST polling works well for general match updates, but time-critical events like goals and red cards benefit from WebSockets or Server-Sent Events (SSE). Developers often combine REST polling with WebSockets to balance scalability with responsiveness. Sportmonks, for instance, updates live scores approximately every 15 seconds, with backend systems polling the API on set timers and pushing results to client applications through Redis.
| Delivery method | Best use case | Typical latency |
|---|---|---|
| REST polling | General match state updates | 10–15 seconds |
| WebSockets | Goals, cards, critical events | Under 1 second |
| Server-Sent Events (SSE) | One-way live commentary feeds | 1–3 seconds |
| CDN edge caching | Global traffic distribution | Sub-second read |
Pro Tip: If a live stats app feels slightly behind a TV broadcast, it is likely using REST polling rather than WebSockets for its critical event delivery.
What advanced metrics do World Cup live stats provide?
The scoreline is the least interesting number in a live football stats feed. FIFA’s Technical Study Group analyzes all World Cup games using six camera angles, generating thousands of data points per match that include metrics most fans have never heard of.
Expected Goals (xG) is the most widely recognized advanced metric. It assigns a probability value to each shot based on factors like distance, angle, and assist type. A shot from six yards out with no defenders has a high xG; a speculative long-range effort has a low one. Tracking xG live tells you whether a team is creating genuinely dangerous chances or just shooting from distance.
Beyond xG, live data feeds now include:
- Line breaks: The number of times a team successfully passes through an opponent’s defensive line, indicating penetration quality.
- Pressures and forced turnovers: How often a team applies pressure high up the pitch and wins the ball back as a result.
- Time to ball recovery: The average seconds a team takes to regain possession after losing it, a direct measure of defensive intensity.
- Team compactness: The average distance between the defensive and attacking lines, showing how organized a team’s shape is.
- Sprint maps and heatmaps: Visual representations of where players run fastest and spend the most time, generated directly from fusing optical tracking with human event data.
| Metric | What it measures | Why it matters |
|---|---|---|
| Expected Goals (xG) | Shot quality probability | Shows true attacking threat beyond shot count |
| Team compactness | Distance between defensive and attacking lines | Reveals defensive organization in real time |
| Pressures | High-press actions per match | Indicates tactical intensity and pressing style |
| Time to recovery | Seconds to regain possession | Measures defensive work rate and transition speed |
These metrics are not produced by a single data source. They result from fusing the analyst’s event log with the optical system’s spatial coordinates. A pressure, for example, requires knowing both that a player moved toward an opponent (optical) and that the opponent had the ball at that moment (analyst-coded).
How do platforms ensure accuracy during live delivery?
Speed and accuracy pull in opposite directions during a live match. Platforms that publish stats instantly risk displaying unverified data. Platforms that verify everything risk falling behind the action.
The solution is a verification engine that cross-checks multiple data providers simultaneously. Live stats platforms reconcile discrepancies by cross-verifying multiple feeds to avoid source drift, a condition where two providers report conflicting values for the same event. A goal credited to the wrong player, or a foul logged a minute late, creates source drift that damages credibility.
“Delays under one second may be introduced purposely to vet conflicting signals before displaying official stats.” This deliberate micro-delay is the industry’s answer to the accuracy-versus-speed tradeoff.
Data verification engines compare timestamp streams from multiple providers to detect inconsistencies before they reach the end user. When two feeds agree, the data publishes immediately. When they conflict, the system holds the update until a third source resolves the discrepancy.
Traffic volume adds another layer of complexity. Massive traffic spikes during World Cup matches require edge caching and refresh optimization to prevent performance degradation. A match involving major national teams can generate millions of simultaneous data requests. Without CDN edge caching and optimized polling logic, the infrastructure collapses under the load.
Pro Tip: A platform that shows a goal two seconds after it happens is likely running a verification pass. That brief delay is a sign of data integrity, not a technical failure.
How can fans get the most from live World Cup stats?
Understanding live match statistics changes how you watch football. Fans who read xG alongside the scoreline see a different match than those who only track goals.
The most practical starting point is learning to read a live xG chart. If a team has 0.8 xG at halftime but trails 1-0, the stats say the match is closer than the scoreline suggests. That context shapes how you interpret the second half. Platforms like Betsyscore’s live match feed present these figures in real time, alongside momentum indicators that show which team is controlling the match minute by minute.
Heatmaps and sprint maps reward closer attention. A winger’s heatmap concentrated near the halfway line tells you the team is defending deep. A striker’s heatmap spread across the width of the box tells you the team is playing a fluid attacking system. These visuals come directly from the optical tracking stream and update continuously throughout the match.
For fans who want to go deeper, the Betsyscore blog covers how live stats integrate into match analysis and what specific metrics mean in tactical terms. Interactive tools like the BBC’s 3D viewer, which uses Unity WebGL to render skeletal player data live in a browser, show where the technology is heading for fan engagement. Choosing a reliable source matters. Platforms built on EPTS-compliant data with multi-feed verification produce more trustworthy numbers than those relying on a single data provider.
Key Takeaways
World Cup live stats work because human event-coding and optical tracking combine in real time, verified through multi-feed engines, and delivered via APIs and edge caching to fans worldwide within seconds.
| Point | Details |
|---|---|
| Dual data streams | Human analysts and optical cameras each contribute distinct, complementary data types. |
| EPTS standard | The IFAB-mandated EPTS format ensures positional data is consistent across all platforms. |
| Delivery architecture | REST polling, WebSockets, Redis, and CDN edge caching together achieve near real-time delivery at global scale. |
| Advanced metrics | xG, pressures, compactness, and sprint maps come from fusing both data streams, not from a single source. |
| Accuracy vs. speed | Verification engines introduce micro-delays under one second to resolve source drift before publishing stats. |
Why live stats have changed what it means to watch football
I have spent years tracking how football data has moved from the press box to the pocket of every fan, and the shift is more significant than most people realize. When I first started following live match data, the feed was a scoreline and a possession percentage. Now a single World Cup match generates thousands of verified data points per minute, covering everything from a center back’s compactness rating to a winger’s sprint distance in the final ten minutes.
What strikes me most is how the technology has made tactical literacy accessible. You no longer need a coaching background to understand why a team is losing despite dominating possession. The xG chart tells you. The pressure map tells you. The time-to-recovery metric tells you. These numbers were always available to analysts inside clubs. Now they are available to anyone watching on a phone.
The challenge I see going forward is not technical. The infrastructure for delivering live stats at scale is mature and well-tested. The real challenge is interpretation. A fan who sees an xG of 2.1 versus 0.4 and understands what it means gets a fundamentally richer experience than one who ignores it. The technology has outpaced the education. Platforms that close that gap, by presenting data with context rather than just numbers, will define the next era of football viewership. AI-powered prediction layers, like the win-probability models built from xG and recent form, are already moving in that direction.
— Aria
Betsyscore covers World Cup 2026 live stats in real time
Betsyscore tracks every FIFA World Cup 2026 match with live scores that refresh every few seconds, advanced metrics including xG and momentum indicators, and AI-powered match predictions built from expected goals, recent form, and head-to-head records.

Coverage extends across the Premier League, La Liga, Bundesliga, Serie A, the Champions League, and more than 200 competitions worldwide. The World Cup 2026 hub on Betsyscore brings together live lineups, player profiles, tournament leaderboards, and instant stats in one place. Fans who want the full picture of every match, before kickoff, during play, and after the final whistle, will find everything they need at Betsyscore.
FAQ
How do World Cup live stats reach fans so quickly?
Live stats travel through RESTful APIs backed by Redis in-memory caches and CDN edge servers, achieving updates within 10–15 seconds for general match state and under one second for critical events via WebSockets.
What is EPTS and why does it matter for live football data?
EPTS stands for Electronic Performance and Tracking Systems, the data format standardized by IFAB in 2015 that ensures all positional tracking data is structured consistently across broadcasters and platforms.
What does Expected Goals (xG) measure in a live match?
xG assigns a probability score to each shot based on distance, angle, and assist type, showing how likely a shot was to result in a goal and giving a more accurate picture of attacking quality than shot count alone.
How do platforms handle data errors during live matches?
Verification engines cross-check multiple data providers simultaneously and introduce micro-delays under one second to resolve conflicting signals, a process called source drift reconciliation, before publishing any official stat.
Why do some live stats apps update slower than others?
Apps using REST polling update every 10–15 seconds by design, while apps using WebSockets or Server-Sent Events push critical events in under one second. The difference is architecture, not data quality.