Champions League Performance Data: What Fans Need to Know
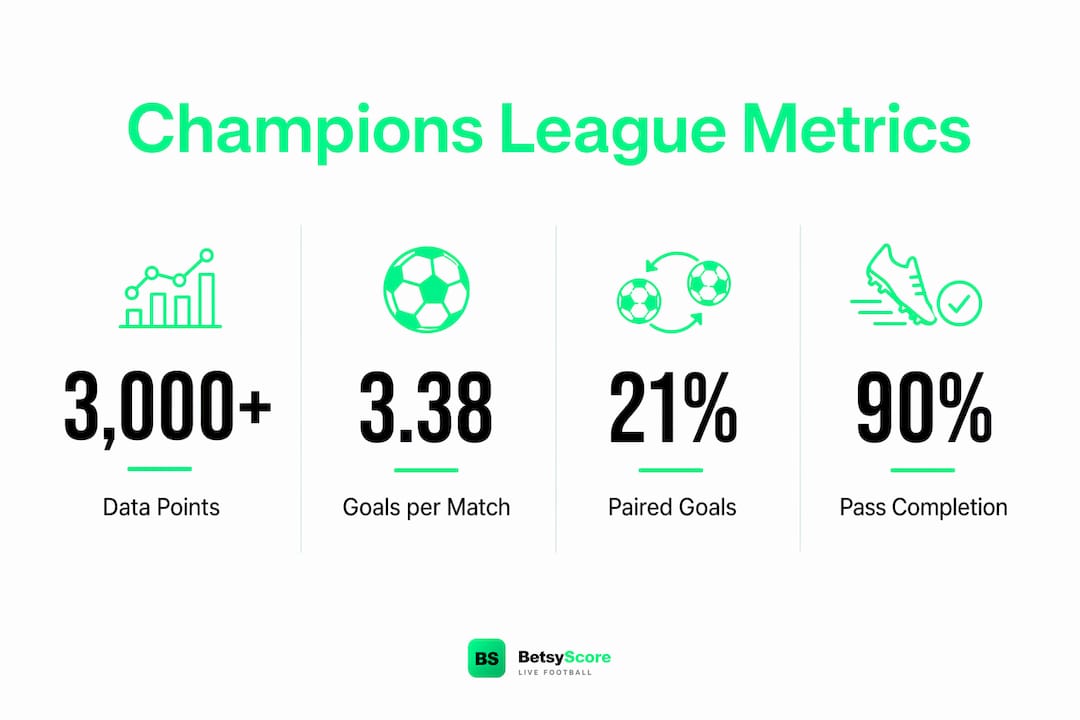
Champions League performance data is the detailed statistical record of every player and team action used to analyze matches and outcomes in UEFA’s top club competition. Modern tracking systems capture over 3,000 data points per match across 30 seasons of competition history. That depth transforms raw match events into measurable insights about tactics, form, and probability. Providers like Opta and Stats Perform collect this data in real time, feeding broadcasters, analysts, and platforms like Betsyscore with the numbers that explain what the eye cannot always see.
What is Champions League performance data made of?
Champions League performance data falls into two broad categories: basic event data and advanced analytics. Both are necessary for a complete picture of any match.
Basic event data covers the actions every fan already tracks:
- Goals and assists: The primary outcome metrics, recorded with timestamps and positional coordinates.
- Yellow and red cards: Disciplinary events that affect team shape and game state.
- Substitutions: Tactical changes that shift momentum and alter pressing structures.
- Shots and shots on target: Volume indicators that show attacking intent.
- Fouls and set pieces: Situational events that research links directly to scoring opportunities.
Advanced metrics go further. Expected goals (xG) measures the quality of each shot based on location, angle, and assist type. Live Win Probability updates second by second as the match state changes. Momentum indicators show which team is controlling territory and pressing effectively at any given minute.
Event-stream data captures every pass, tackle, and ball touch with a timestamp. That granularity allows analysts to calculate metrics like Live Win Probability in real time rather than waiting for final scores.

Pro Tip: When reading Champions League statistics, always check whether a metric is an outcome stat (goals scored) or a predictive metric (xG). The two answer very different questions about a team’s actual quality.
How is Champions League data used to analyze teams and players?
Performance analysis in the Champions League relies on filtering raw data through situational context. Four key performance indicators drive most professional evaluations:
- Goals and xG differential: A team that consistently scores more goals than its xG suggests finishing quality above average. A team that scores fewer than its xG may be underperforming or facing poor finishing luck.
- Pressing effectiveness: Pressing in the attacking third is a stronger predictor of high-quality scoring chances than raw passing numbers. Analysts track how often a team wins the ball high up the pitch and converts those recoveries into shots.
- Shots on target rate: Volume alone misleads. A team with 15 shots but only 2 on target is less dangerous than a team with 8 shots and 6 on target.
- Squad value and fouls: Research on the Champions League new format shows that early scoring, squad value, and foul rates are the strongest predictors of match outcomes, with models reaching up to 84.4% accuracy in the 2024/25 season.
That 84.4% accuracy figure is significant. It means scoring the first goal is not just psychologically important. It is statistically the single strongest indicator of which team wins.
“Scoring the first goal is the strongest indicator of success in the Champions League league phase.” — UEFA Champions League discriminant analysis research, 2024/25 season.
Player profiling uses the same data at an individual level. Analysts track a striker’s xG per 90 minutes to separate clinical finishers from high-volume shooters. Midfielders are evaluated on progressive passes and pressing triggers rather than total touches. Defenders are assessed through aerial duel success rates and recovery runs, not just clearances.
Situational context is critical throughout. A midfielder who completes 90% of his passes while his team leads by two goals is not necessarily more skilled than one completing 75% while chasing the game. Filtering stats by game state prevents that kind of misreading.
What are the challenges in interpreting Champions League data?
Champions League performance data rewards careful interpretation. The most common mistake is treating outcome stats as proof of quality.
| Metric type | What it measures | Common misreading |
|---|---|---|
| Goals scored | Actual outcomes | Assumes finishing quality without checking xG |
| xG (expected goals) | Shot quality and volume | Ignored when a team wins despite low xG |
| Possession percentage | Ball retention | Treated as dominance regardless of game state |
| Pass completion rate | Technical accuracy | Inflated when team plays safe while leading |
| Pressing intensity | Defensive aggression | Confused with high defensive line positioning |
Teams can lose despite high xG, which indicates quality performance masked by randomness. Over a single match, luck plays a real role. Over a full season, xG and actual goals converge for most teams.
Cross-era comparison adds another layer of complexity. Comparing Champions League performance across different eras is difficult because team strategies, data availability, and competition formats have all changed. A team that dominated in the early 2000s operated under different tactical norms and faced different data collection standards than a team competing today.
Pro Tip: Never compare a player’s Champions League statistics across different eras without accounting for format changes. The group stage expanded, the number of matches changed, and tracking technology improved significantly after 2010.
The shift to data-driven tactical management has also changed which clubs compete at the top. Analysts note that newer contenders use performance data to identify undervalued players and exploit tactical mismatches, making historical dominance a less reliable guide to future success.
How does Champions League data enhance the fan and analyst experience?
Real-time performance data has changed how fans engage with Champions League matches. Modern football data has shifted from static record-keeping to dynamic live storytelling, revealing hidden momentum and dynamics that broadcast cameras alone cannot capture.
For fans watching live, the practical benefits are clear:
- Momentum tracking: Live momentum indicators show which team is pressing harder and creating more danger, even during goalless spells that appear uneventful on the surface.
- Win probability shifts: A team that concedes in the 30th minute but maintains high xG and pressing intensity may still be the statistical favorite. Live win probability communicates that story in real time.
- Fantasy and prediction games: Champions League statistics feed fantasy platforms and prediction models, giving fans a data foundation for their picks rather than relying on reputation alone.
- Deeper match narratives: Broadcasters use event-stream data to explain why a goal happened, not just that it happened. A pressing trigger in the 67th minute that led to a turnover and a goal three passes later is a story that only data can tell fully.
The 2025/26 UEFA Champions League league phase recorded 487 goals at 3.38 per match, with 21% of goals arriving as paired goals within five minutes of each other. That clustering pattern is invisible without data. With it, analysts can identify the specific match phases where teams are most vulnerable to conceding in quick succession.
Platforms like Betsyscore translate this data into fan-friendly formats, combining live scores and AI predictions with momentum reads that update every few seconds. The result is a match experience grounded in evidence rather than commentary alone.
Key Takeaways
Champions League performance data is most valuable when analysts separate predictive metrics like xG from outcome stats and apply situational context to every figure.
| Point | Details |
|---|---|
| Data scope is vast | Over 3,000 data points per match are tracked across 30 seasons of Champions League history. |
| First goal predicts outcomes | Scoring first is the strongest single predictor of winning, with model accuracy reaching 84.4%. |
| xG beats raw goals | Expected goals measures shot quality, revealing true performance beyond final scorelines. |
| Context prevents misreading | Game state filters (leading, trailing, drawing) stop analysts from misinterpreting reactive play as skill. |
| Live data tells the full story | Event-stream data updates win probability second by second, making momentum visible to fans in real time. |
Data has changed what it means to watch the Champions League
I have followed Champions League analysis for years, and the shift that stands out most is not the volume of data. It is the quality of the questions analysts now ask. A decade ago, the debate after a match centered on goals and possession. Now it centers on xG differential, pressing triggers, and whether a team’s win reflected genuine quality or a goalkeeper having an exceptional night.
The metric that changed my viewing experience most was xG. Once you understand that a team can create 2.8 xG and lose 1-0, you stop reading that result as a collapse. You read it as a performance that deserved a different outcome. That reframing makes the Champions League far more interesting to follow across a full campaign, not just match by match.
The next shift is already visible. AI-driven narrative tools are starting to generate real-time match stories that explain tactical patterns as they develop. The role of UEFA rankings in seeding and format decisions will also become more data-transparent over time. Analysts who build fluency in these metrics now will be well ahead when those tools become standard in broadcasts.
— Aria
Betsyscore brings Champions League data to life
Betsyscore covers the Champions League with live scores that refresh every few seconds, AI-powered win probability built from xG, recent form, and head-to-head records, plus a minute-by-minute momentum tracker that shows which team is controlling the match.
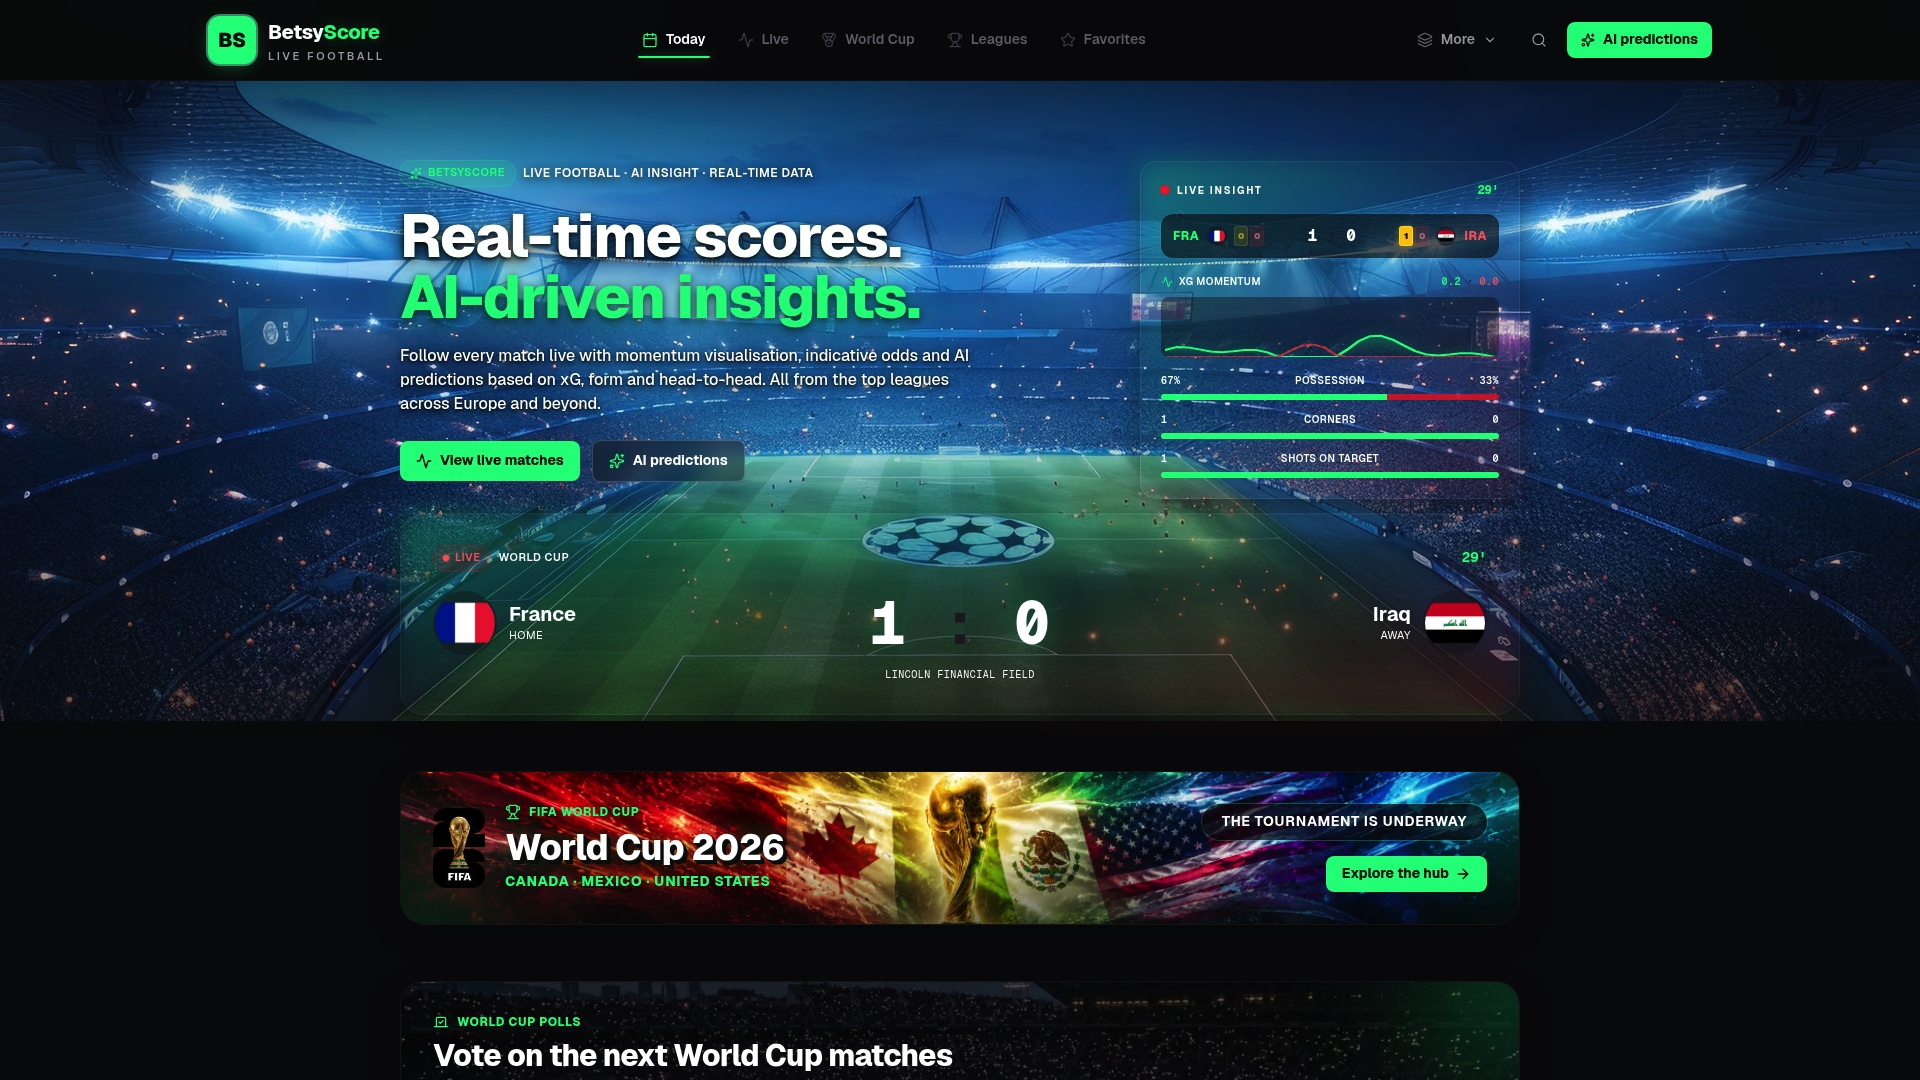
Every Champions League match on Betsyscore includes live lineups, instant stats, and player performance metrics updated throughout the game. For fans who want to go deeper, AI predictions are available before kickoff and update as the match develops. Check the live scores page for real-time Champions League coverage across every round of the competition.
FAQ
What is Champions League performance data?
Champions League performance data is the complete statistical record of player and team actions in UEFA Champions League matches. It covers over 3,000 tracked events per match, from basic stats like goals and cards to advanced metrics like expected goals and live win probability.
What metrics are used in Champions League analysis?
The core metrics are goals, assists, shots on target, expected goals (xG), pressing effectiveness, and live win probability. Research shows that scoring the first goal and squad value are the strongest predictors of match outcomes.
How does Champions League live data work?
Event-stream technology timestamps every in-game action, from passes to tackles, as it happens. Those events feed algorithms that calculate live metrics like win probability and momentum shifts in real time.
Why is xG more useful than goals scored?
Expected goals measures the quality of each shot based on location and angle, not just whether it went in. A team with high xG that loses may have outperformed its opponent despite the scoreline.
How far back does Champions League historical data go?
Structured Champions League data covers 30 seasons of competition history. Cross-era comparisons require caution because competition formats, tracking technology, and team strategies have changed significantly over that period.