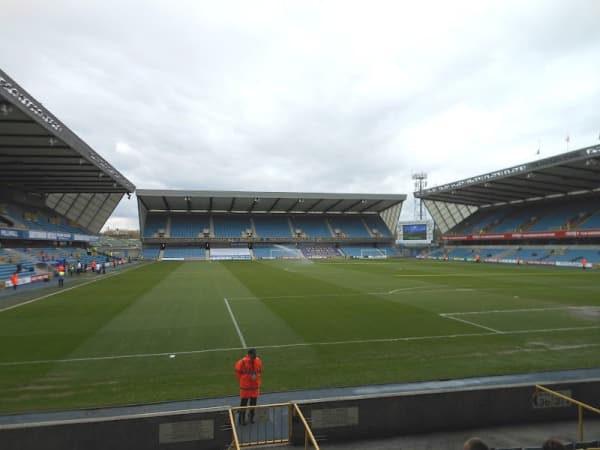
Millwall 2-2 West Ham: result and stats, Championship
 Millwall4-2-3-1Line ups4-4-2West Ham



















 David Livermore
Substitutions
- 70'M. Sykes
 176.9E. Baggott
 126.0
126.0 - 81'T. Arconte
 77.0K. Lisbie
 226.7
226.7 - 81'J. Metcalfe
 147.6M. Servais
 86.9
86.9 - 90'D. Mazou-Sacko
 496.9
496.9

Unused
- M. CrocombeG
 15
15 - D. BatthD
 23
23 - A. DoughtyM
 45
45 - D. KellyM
 16
16 - Y. IssoufouF
 35
35
Substitutions
- 46'K. Walker-Peters
 26.2M. Kante
 178.2
178.2 - 46'
- 68'
- 90'T. Castellanos
 116.0
116.0



Unused
- F. HerrickG
 49
49 - O. ScarlesD
 30
30 - A. GolambeckisD
 58
58 - S. MagassaM
 27
27 - J. AjalaF
 66
66
Home
 OutJ. CoburnMuscle Injury
 OutT. CramaAnkle Injury
 OutC. De NorreInjury
 OutR. EsseAnkle Injury
 OutM. IvanovicHamstring Injury
 OutL. JensenInjury
 OutR. LeonardHamstring Injury
 OutM. LuongoKnee Injury
Away
 OutA. AreolaCalf Injury
 OutT. SoucekAnkle Injury
 OutJ. VeltmanInjury

| Player | ||||||
|---|---|---|---|---|---|---|
 Filip MarschallG Filip MarschallG | 4 | 2 | 2,44 | +0,44 | 15/27 | 13/25 |
 Mads HermansenG Mads HermansenG | 4 | 2 | 1,98 | -0,02 | 22/26 | 2/6 |
Live statsPossession & Passing
Attack
Box & Quality
Defense & Discipline
Half by half
The same match, split at the break. Which half did each side actually win?
First half
Second half
xG analytics
MillwallWest HamExpected goals weighs every shot by the historic conversion rate of similar chances. Higher xG means better scoring opportunities, regardless of whether they went in.
xG race
34 shotsChance quality as it built up. A steep step is a big chance.
Millwall3,02 xG · 2 scoredWest Ham1,88 xG · 2 scoredHow those chances were made
Momentum
16 swingsWhich side was on top, minute by minute. A taller bar is heavier pressure.
Millwall56% pressureWest Ham44% pressureMatch replay
91'2-2 90' Off target Lyndon Dykes 0.10 xG · Set piece · Right foot
Shot map
19 v 15Millwall shoot right, West Ham left. Bigger dot = better chance.
Goal mouth
25 on target · 4 scoredWhere each shot on target crossed the line. Placement beats power.
Average positions
Each starter's average position on the ball, with the number of those actions inside the chip. Both sides attack left to right. Tap a player to see where they actually were.
MillwallDefensive line 38%West HamDefensive line 38%An average, not a movement map: it says where a player's actions balanced out, not where they ran.
Passing network
Each player at his average position, sized by passes made. Lines join team-mates with 5 or more passes between them (fewer when a side made its first change early), thicker for more. Counted until each side's first substitution. Both sides attack left to right. Tap a player to isolate his links.
MillwallUntil 70'Most-connected pair: Cooper and Sturge, 5 passes between them.
West HamUntil 45'Most-connected pairs: Morato and Solomon; Mavropanos and Walker-Peters. 15 passes each.
Tactical battle
35control65In possession
Field tilt is each side's share of play in the final third.
Out of possession
↓ Lower is better, so the longer bar always wins. PPDA is opponent passes allowed per defensive action.
Carrying
Distances are how far the ball was moved forward, not how far anybody ran.
Beating the press
A take-on is a player going past an opponent with the ball at his feet.
Threat created
xT values where a possession reached; VAEP values every action by how much it shifted the chance of a goal.
Tempo
An attack is direct when it moves upfield quickly rather than through many passes.
More match stats
Attack
Passing
Duels
Defending
Goal profile
This seasonHow often each side reaches a scoreline, across 8 matches each.
Share of their matchesThey score
They concede
Heaviest results
best 4-0 (H)·worst 1-5 (A)
best 6-0 (H)·worst 1-2 (H)
Match summary
Millwall and West Ham drew 2-2 at The Den in the Championship. Millwall led 2-0 at half-time. Scorers: C. Taylor (16'), C. Neghli (45') for Millwall; M. Kante (74'), K. Mavropanos (80') for West Ham. West Ham finished with ten men after Mohamadou Kanté was sent off. In their last 3 meetings, Millwall have won 0, West Ham 1, with 2 drawn. Full match stats, lineups and player ratings are all on this page.

→ Double chance: West Ham or draw
Why this prediction
The factors the model weighed, each split between the two sides.
Share per factor
Who will win?
Cast your vote!
Head-to-headLast 3 meetings
0Millwall