

















194'

Leeds
 Edmund Riemer
 226.7
 86.5
 16
 15
 26
 10
 23
 44
 11
 66.4
 37.1
 187.9A
 106.5
 12
 4
 41
 11
 9
 31










 VS
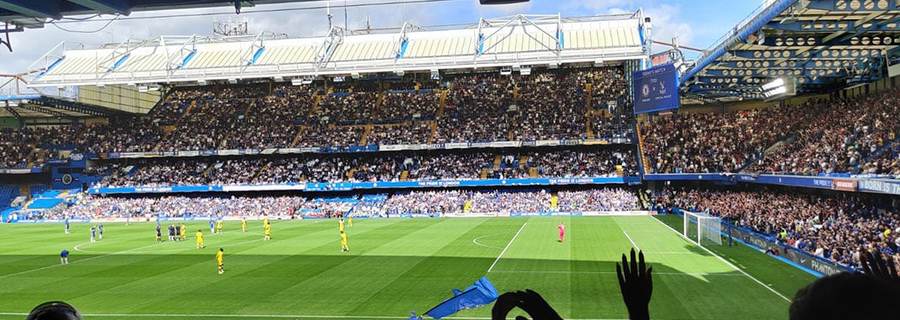
Chelsea FC vs Leeds United
 VS
Chelsea FC vs Leeds United

Better than 93% of Premier League midfielders for expected threat.
Per 90 minutes this season, against all 83 midfielders with at least 300 minutes.
Premier League 2026/27, through 8 Nov. Rank means better than that share of the group, in their most-played position.


| Player | |||||
|---|---|---|---|---|---|
| S. LammensG | 3 | 0,95 | -0,05 | 16/33 | 13/31 |
| J. TraffordG | 2 | 0,95 | -0,05 | 37/50 | 7/20 |
Chance quality as it built up. A steep step is a big chance.
Leeds1,44 xG · 1 scoredManchester United0,92 xG · 1 scoredHow those chances were made
Leeds shoot right, Manchester United left. Bigger dot = better chance.
Where each shot on target crossed the line. Placement beats power.
Calvert-Lewin's 51' chance was the biggest of the match: 0,52 xG, scored.
Every shot on its minute, Leeds above and Manchester United below. The longer the bar, the bigger the chance. Faces on goals and on chances of 0,3 xG or more.
Leeds12 shots · 1,44 xGManchester United13 shots · 0,92 xGLeedsManchester UnitedExpected goals weighs every shot by the historic conversion rate of similar chances. Higher xG means better scoring opportunities, regardless of whether they went in.
Manchester United have 4.7 fewer points than their chances earned.
Every Premier League shot this season turned into expected points (xPTS): how many points each side's chances were worth.
Premier League 2026/27, 100 of 100 finished matches through 8 Nov, league only. A measure of chances, not a verdict.
Which side was on top, minute by minute. A taller bar is heavier pressure.
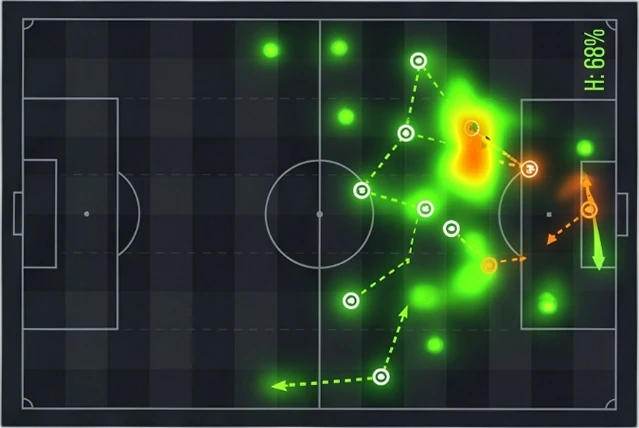
Leeds63% pressureManchester United37% pressure1-190' Saved Matheus Cunha 0.01 xG · Regular play · Right footEach starter's average position on the ball, with the number of those actions inside the chip. Both sides attack left to right. Tap a player to see where they actually were.
LeedsDefensive line 45%Manchester UnitedDefensive line 28%An average, not a movement map: it says where a player's actions balanced out, not where they ran.
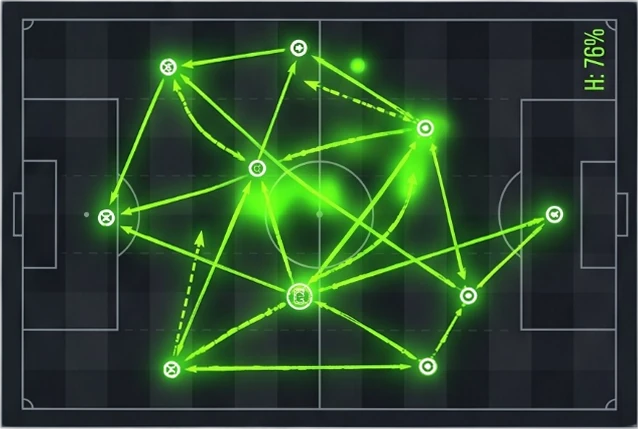
Each player at his average position, sized by passes made. Lines join team-mates with 5 or more passes between them (fewer when a side made its first change early), thicker for more. Counted until each side's first substitution. Both sides attack left to right. Tap a player to isolate his links.
LeedsUntil 74'Most-connected pair: Muharemović and Elvedi, 27 passes between them.
Manchester UnitedUntil 45'Most-connected pair: Tielemans and Diallo, 7 passes between them.
Distance covered and sprints, per player.
Leeds115.5 km A. Stach12.0 km8×
 E. Ampadu11.6 km8×
 J. Justin11.5 km13×
 J. Bogle11.5 km18×
 T. Muharemović10.8 km8×Manchester United111.5 km
 Bruno Fernandes11.4 km9×
 Andrey Santos10.9 km4×
 B. Mbeumo10.6 km16×Y. Tielemans10.5 km14×
 Diogo Dalot10.5 km15×58control42
Field tilt is each side's share of play in the final third.
↓ Lower is better, so the longer bar always wins. PPDA is opponent passes allowed per defensive action.
Distances are how far the ball was moved forward, not how far anybody ran.
A take-on is a player going past an opponent with the ball at his feet.
xT values where a possession reached; VAEP values every action by how much it shifted the chance of a goal.
An attack is direct when it moves upfield quickly rather than through many passes.
The goal that swung the win probability the most. Press play to replay the move, touch by touch.
B. MbeumoLeft foot · assist Y. Tielemans35'Live statsThe same match, split at the break. Which half did each side actually win?
Leeds take 1.8 points a game from weaker sides, 0.5 from stronger ones.
Points per game against stronger and weaker opponents, over each side's last 10 matches in all competitions.
Leeds0.5 (4)1.8 (5)Manchester United0.6 (7)1.5 (2)Points per game (matches). An equal side counts as neither.
Small samples, so read this as a trend. Which opponent counts as stronger is the data provider's call.
Leeds and Manchester United drew 1-1 at Elland Road in the Premier League. Manchester United led 1-0 at half-time. Scorers: D. Calvert-Lewin (51') for Leeds; B. Mbeumo (35') for Manchester United. In their last 13 meetings, Leeds have won 1, Manchester United 7, with 5 drawn. Full match stats, lineups and player ratings are all on this page.
→ Double chance: Leeds or draw
The factors the model weighed, each split between the two sides.
Share per factorCast your vote!
How often each side reaches a scoreline, across 10 matches each.
Share of their matchesbest 4-1 (H)·worst 0-2 (A)
best 5-2 (H)·worst 0-3 (H)
Each attack set against the defence it meets, zone by zone. Season shares rather than a forecast; a figure beside a share is how far it sits from the league average, shown only where the gap is worth noticing.
LeedsshootallowManchester United479 shots taken · 444 faced
Manchester UnitedshootallowLeeds598 shots taken · 478 faced
Shot locations, not player movement: where the ball was struck from, not where anybody ran. Shares are of each club's own shots, so a side that shoots often is comparable with one that does not.
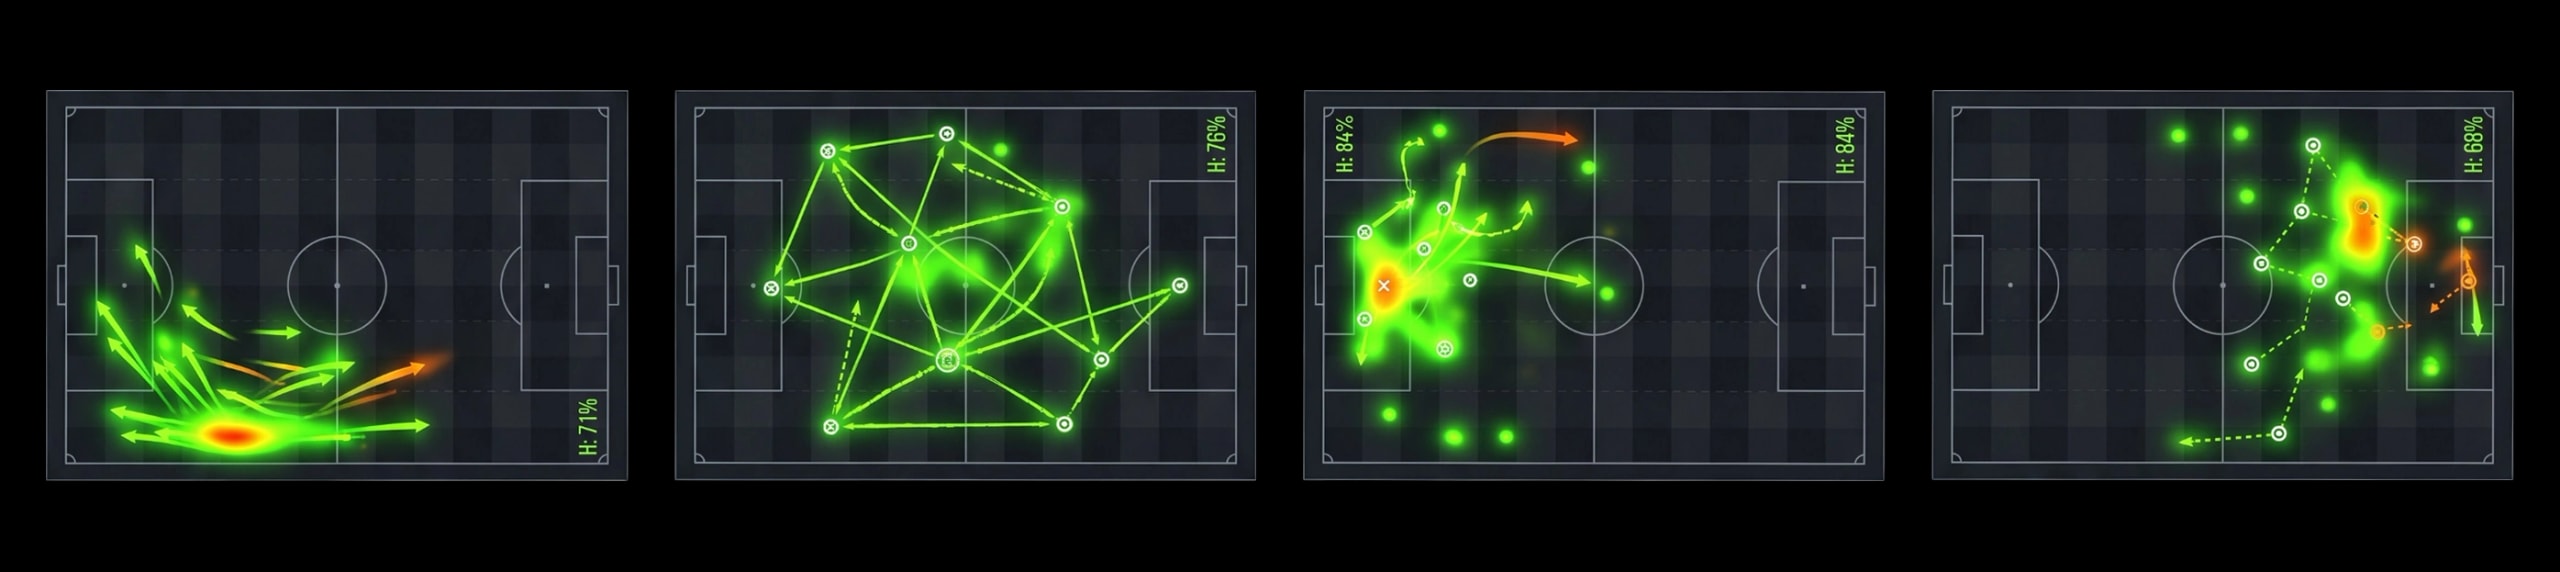
1LeedsLeeds1 - 1Manchester UnitedPremier LeagueManchester United1 - 1LeedsFriendlies ClubsManchester United1 - 2LeedsPremier LeagueLeeds1 - 1Manchester UnitedPremier LeagueManchester United0 - 0LeedsFriendlies ClubsManchester United2 - 0LeedsFriendlies ClubsLeeds0 - 2Manchester UnitedPremier LeagueManchester United2 - 2LeedsPremier LeagueLeeds2 - 4Manchester UnitedPremier LeagueManchester United5 - 1LeedsPremier LeagueLeeds0 - 0Manchester UnitedPremier LeagueManchester United6 - 2LeedsPremier LeagueLeeds0 - 3Manchester UnitedLeague CupRanked by VAEP: how much every pass, carry, shot and tackle raised the team's chance to score, or lowered the opponent's. The glow shows where each player made it.
D. Calvert-Lewin added the most value in this match, most of it going forward.
Every player on one map: attacking value across, defending value up. Tap a player to see why.
Made his value going forward.
Leeds v Manchester United, players with 20+ minutes. Value is VAEP: how much each action raised his side's chance to score (attack) or lowered the opponent's (defence). The lines cross at the middle player of this match.
LeedsScores most 46-60 · concedes most 31-45
Manchester UnitedScores most 61-75 · concedes most 46-60
The leading scorers and assist-makers in the Premier League this season.