Fenerbahçe 1-1 AS Roma: result and stats, UEFA Champions League


- Archie Brown48'

- 39'Bryan Cristante
 Fenerbahçe4-3-3















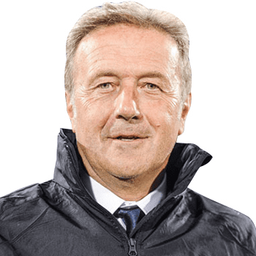 Zeki Murat Göle
Substitutions
- 62'
- 72'K. Aktürkoğlu
 76.3O. Aydın
 706.6
706.6 - 72'


Unused
- Nélson SemedoD
 27
27 - Y. DemirD
 14
14 - M. GünokG
 34
34 - İ. KahveciM
 17
17 - O. MimovićD
 77
77 - N. DorgelesF
 45
45 - K. Peprah OppongD
 21
21 - T. ÇetinG
 13
13
Tullio GrittiSubstitutions
- 53'M. Koné
 177.2N. Pisilli
 616.8
616.8 - 74'G. Mancini
 236.6L. Balerdi
 266.2
266.2 - 74'
- 74'M. Soulé
 186.5Rodrigo Mora
 865.9
865.9 - 87'D. Malen
 147.0AM. de Roon
 156.3
156.3

Unused
- S. CastroF
 9
9 - G. De MarziG
 70
70 - D. GhilardiD
 87
87 - P. GolliniG
 95
95 - K. KoulierakisD
 3
3 - E. LulliD
 77
77
Home
 OutM. AsensioMuscle Injury
 OutA. DioufOff the roster
 OutA. FallOff the roster
 OutM. GuendouziRed Card
 OutJ. OosterwoldeAchilles Tendon Injury
 OutM. YandasOff the roster
Away
 OutM. BahKnee Injury
 OutL. PellegriniThigh Injury

Highest-rated players
| Player | |||||
|---|---|---|---|---|---|
 M. SvilarG M. SvilarG | 4 | 1,57 | +0,57 | 22/24 | 4/6 |
 EdersonG EdersonG | 2 | 1,12 | +0,12 | 32/47 | 7/22 |
Live statsPossession & Passing
Attack
Box & Quality
Defense & Discipline
Half by half
The same match, split at the break. Which half did each side actually win?
First half
Second half
xG analytics
FenerbahçeAS RomaExpected goals weighs every shot by the historic conversion rate of similar chances. Higher xG means better scoring opportunities, regardless of whether they went in.
xG race
19 shotsChance quality as it built up. A steep step is a big chance.
Fenerbahçe1,66 xG · 1 scoredAS Roma0,53 xG · 1 scoredHow those chances were made
Momentum
21 swingsWhich side was on top, minute by minute. A taller bar is heavier pressure.
Fenerbahçe28% pressureAS Roma72% pressureMatch replay
91'1-1 86' Off the post Nathan Aké 0.07 xG · Set piece · Header
Shot map
11 v 8Fenerbahçe shoot right, AS Roma left. Bigger dot = better chance.
Goal mouth
12 on target · 2 scoredWhere each shot on target crossed the line. Placement beats power.
Average positions
Each starter's average position on the ball, with the number of those actions inside the chip. Both sides attack left to right. Tap a player to see where they actually were.
FenerbahçeDefensive line 27%AS RomaDefensive line 56%An average, not a movement map: it says where a player's actions balanced out, not where they ran.
Passing network
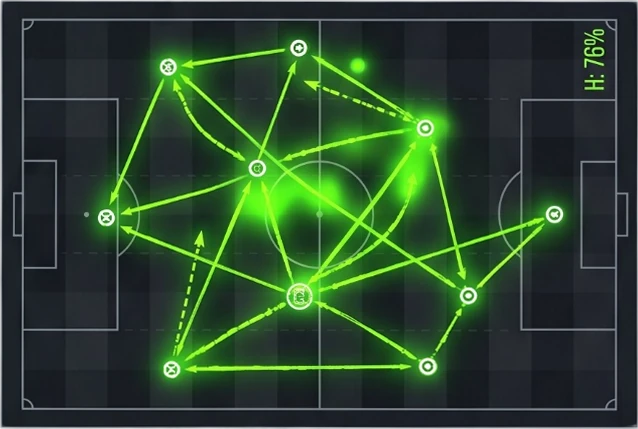
Each player at his average position, sized by passes made. Lines join team-mates with 5 or more passes between them (fewer when a side made its first change early), thicker for more. Counted until each side's first substitution. Both sides attack left to right. Tap a player to isolate his links.
FenerbahçeUntil 62'Most-connected pair: Škriniar and Müldür, 21 passes between them.
AS RomaUntil 53'Most-connected pair: Cristante and Hermoso, 19 passes between them.
Tactical battle
28control72In possession
Field tilt is each side's share of play in the final third.
Out of possession
↓ Lower is better, so the longer bar always wins. PPDA is opponent passes allowed per defensive action.
Carrying
Distances are how far the ball was moved forward, not how far anybody ran.
Beating the press
A take-on is a player going past an opponent with the ball at his feet.
Threat created
xT values where a possession reached; VAEP values every action by how much it shifted the chance of a goal.
Tempo
An attack is direct when it moves upfield quickly rather than through many passes.
More match stats
Attack
Passing
Duels
Defending
Match summary
Fenerbahçe and AS Roma drew 1-1 at Chobani Stadium in the UEFA Champions League. AS Roma led 1-0 at half-time. Scorers: Archie Brown (48') for Fenerbahçe; Bryan Cristante (39') for AS Roma. In their last 1 meeting, Fenerbahçe have won 0, AS Roma 0, with 1 drawn. Full match stats, lineups and player ratings are all on this page.

→ Double chance: AS Roma or draw

Who will win?
Cast your vote!
Head-to-headLast 1 meetings
0Fenerbahçe