Barcelona 7-2 Racing Santander: result and stats, La Liga


- J. Cancelo8'
- Raphinha25' (pen), 42', 67' (pen)
- Gabriel Jesus79'
- Lamine Yamal89'

- 30'M. Gueye
- 36' (og)A. Villalibre
- 65'Y. Zabiri
 Barcelona4-3-3

















 Marcus Sorg
Substitutions
- 46'J. Garcia
 16.3W. Szczesny
 135.9
135.9 - 61'
- 61'
- 69'Raphinha
 1110.03Gabriel Jesus
 97.5
97.5 - 78'J. Cancelo
 27.3A. Balde
 37.0
37.0


Unused
- D. LivakovicG
 25
25 - J. KoundeD
 23
23 - P. CubarsiD
 5
5 - X. EspartD
 12
12 - FerminM
 7
7 - A. GordonF
 17
17 - H. AbdelkarimF
 29
29
Pablo ÁlvarezSubstitutions
- 59'
- 59'A. Villalibre
 126.5AI. Vicente
 106.9
106.9 - 59'Pedro Felipe
 225.3I. Luque
 195.9
195.9 - 78'I. Sainz-Maza
 66.5G. Guliashvili
 76.7
76.7 - 86'F. Gonzalez
 166.0J. Salinas
 176.3
176.3

Unused






Home
 OutR. BardghjiKnee Injury
 OutF. de JongKnee Injury
Away
 OutA. AlmeidaRed Card
 OutS. ErikssonShoulder Injury
 OutA. MartinKnee Injury
Highest-rated players
| Player | ||||||
|---|---|---|---|---|---|---|
| Joan GarcíaG | 0 | 1 | 0,38 | -0,62 | 11/13 | 3/5 |
 Julen AgirrezabalaG Julen AgirrezabalaG | 3 | 7 | 4,67 | -1,33 | 19/25 | 5/11 |
| Wojciech SzczęsnyG | 0 | 1 | 0,99 | -0,01 | 3/4 | 0/1 |
Live statsPossession & Passing
Attack
Box & Quality
Defense & Discipline
Half by half
The same match, split at the break. Which half did each side actually win?
First half
Second half
xG analytics
BarcelonaRacing SantanderExpected goals weighs every shot by the historic conversion rate of similar chances. Higher xG means better scoring opportunities, regardless of whether they went in.
xG race
36 shotsChance quality as it built up. A steep step is a big chance.
Barcelona6,65 xG · 7 scoredRacing Santander1,86 xG · 2 scoredHow those chances were made
Momentum
6 swingsWhich side was on top, minute by minute. A taller bar is heavier pressure.
Barcelona99% pressureRacing Santander1% pressureMatch replay
91'7-2 90' Off target Karim Adeyemi 0.12 xG · Regular play · Left foot
Shot map
30 v 5Barcelona shoot right, Racing Santander left. Bigger dot = better chance.
Goal mouth
18 on target · 8 scoredWhere each shot on target crossed the line. Placement beats power.
Average positions
Each starter's average position on the ball, with the number of those actions inside the chip. Both sides attack left to right. Tap a player to see where they actually were.
BarcelonaDefensive line 54%Racing SantanderDefensive line 24%An average, not a movement map: it says where a player's actions balanced out, not where they ran.
Passing network
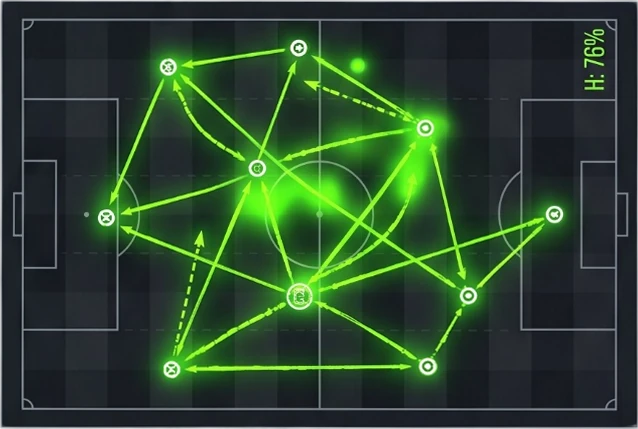
Each player at his average position, sized by passes made. Lines join team-mates with 5 or more passes between them (fewer when a side made its first change early), thicker for more. Counted until each side's first substitution. Both sides attack left to right. Tap a player to isolate his links.
BarcelonaUntil 45'Most-connected pair: García and Yamal, 18 passes between them.
Racing SantanderUntil 59'Most-connected pairs: Canales and Sainz-Maza; Canales and Prati. 9 passes each.
Tactical battle
86control14In possession
Field tilt is each side's share of play in the final third.
Out of possession
↓ Lower is better, so the longer bar always wins. PPDA is opponent passes allowed per defensive action.
Carrying
Distances are how far the ball was moved forward, not how far anybody ran.
Beating the press
A take-on is a player going past an opponent with the ball at his feet.
Threat created
xT values where a possession reached; VAEP values every action by how much it shifted the chance of a goal.
Tempo
An attack is direct when it moves upfield quickly rather than through many passes.
More match stats
Attack
Passing
Duels
Defending
Goal profile
This seasonHow often each side reaches a scoreline, across 8 matches each.
Share of their matchesThey score
They concede
Heaviest results
best 7-2 (H)
best 3-2 (H)·worst 2-7 (A)
Match summary
Barcelona beat Racing Santander 7-2 at Spotify Camp Nou in La Liga. Barcelona led 4-1 at half-time. In their last 6 meetings, Barcelona have won 6, Racing Santander 0, with 0 drawn. Full match stats, lineups and player ratings are all on this page.

→ Winner: Barcelona
Why this prediction
The factors the model weighed, each split between the two sides.
Share per factor
Who will win?
Cast your vote!
Head-to-headLast 6 meetings
6Barcelona